

Introduction
The U.S. Dollar Index (DXY) continues to consolidate between the 96-97 support and the 101 level. Range-bound strategies would be taking centre stage in these market conditions, with longs being taken at the low of the range and shorts taken at the top. There are a few important elements we need to focus on, also with regard to the fundamentals, as the market is eagerly awaiting the FOMC, labor market strength, and inflation data.
For now, let’s take a closer look at the technicals and what we can learn from them.
Market Structure & Trend
Weekly chart
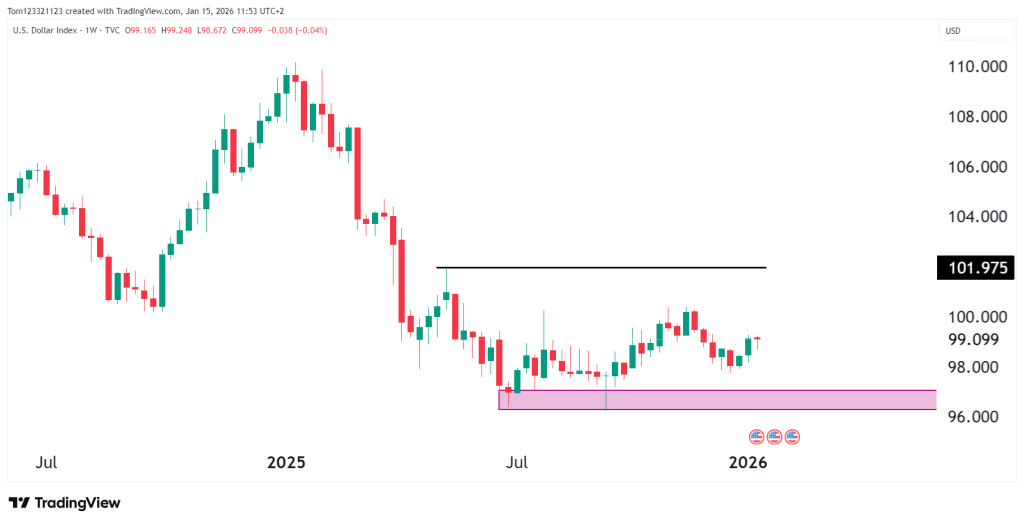
On the weekly timeframe, DXY remains in a corrective-to-bearish structure following the failed attempt to hold above the 110 area back in the middle of 2025. Since that peak, the dollar has formed a sequence of lower highs and lower lows before finding a low around July, and has been moving sideways since then.
For all time frames, the 96-97 support level is the most important to hold for the bulls. From what the weekly shows us, consolidation seems likely for now and into the near term. The news and macro events highlighted in the introduction will play the most important role in the price action of DXY over this year.
Daily chart
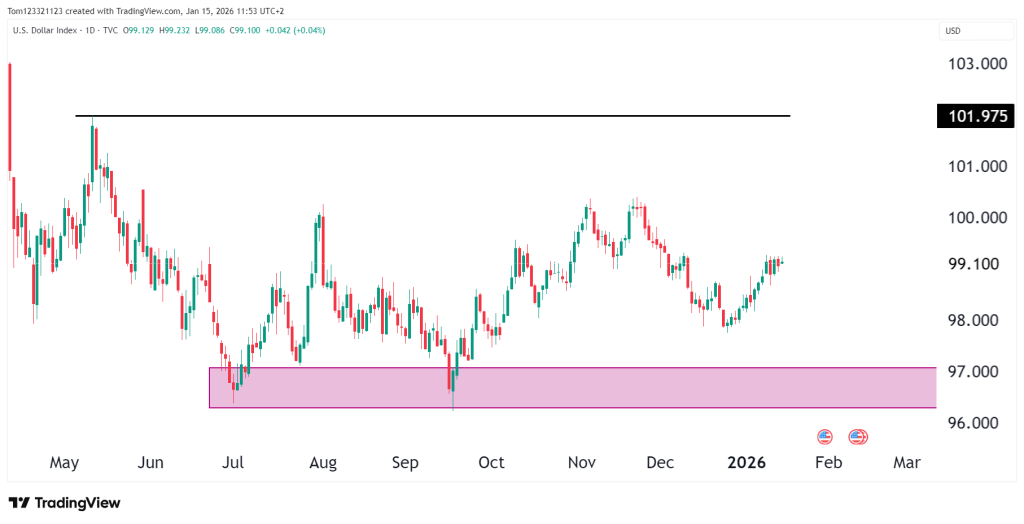
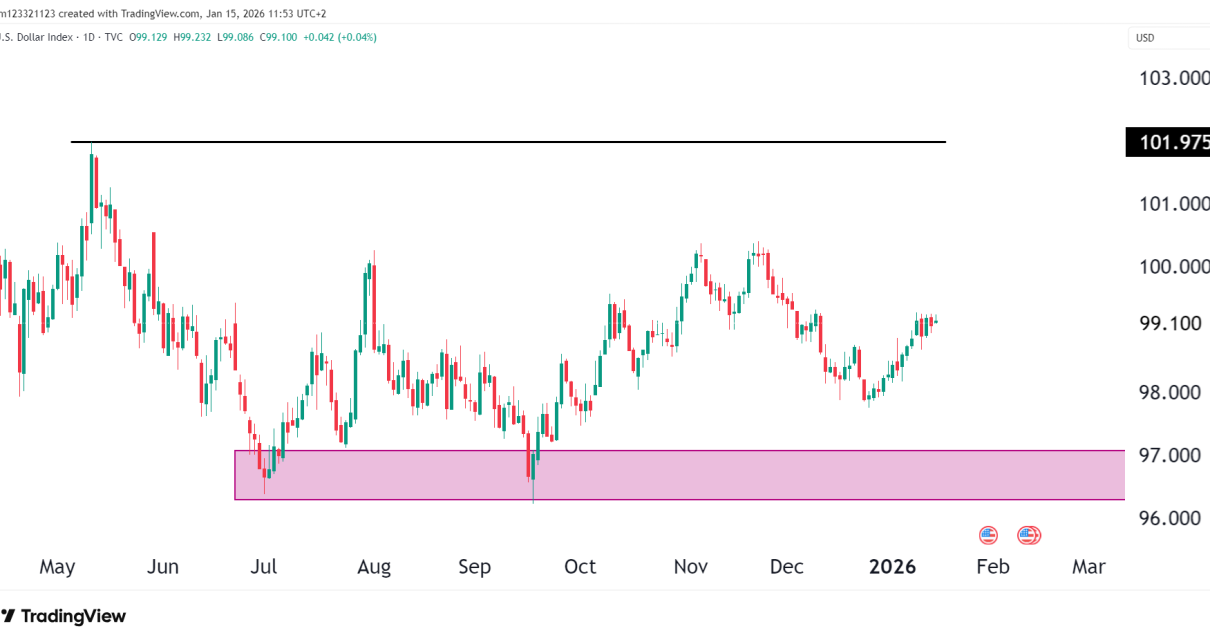
On the daily chart, we can see price is currently trading in the middle of the defined range, with the major support zone highlighted in purple and resistance near 101.50–102.00. Recent price action suggests a gradual recovery off the lows, but momentum remains muted.
Each rally attempt toward resistance has so far been capped, while pullbacks continue to find support above the highlighted zone. This price action is normal after a big move has occurred, especially when it’s on a longer time frame like the weekly chart. The consolidation also means the market is waiting for a news catalyst to give a clearer direction to the trend.
Key Technical Levels
Resistance
- 101.50–102.00: Major resistance and prior breakdown level
- 104.00+: Upper range resistance and trend-shift level
A sustained break above 102 would be a big move from here, but it would improve the medium-term outlook.
Support
- 96.50–97.00: Critical multi-month support zone
- 95.00–95.50: Downside extension if support fails
- 93.00–94.00: Longer-term structural support
A clean break below 96 would shift the balance back in favor of bears.
DXY Facts
What Is the U.S. Dollar Index (DXY)?
The U.S. Dollar Index (DXY) tracks the value of the U.S. dollar against a group of major foreign currencies. Instead of comparing the dollar to just one currency, it shows overall dollar strength or weakness across key trading partners.
DXY was introduced in 1973 after the Bretton Woods system ended and currencies began to float freely. It was originally created by the U.S. Federal Reserve and is now managed by ICE. The index started with a base value of 100 in March 1973.
Which Currencies Are Included?
DXY is made up of six currencies, each with a set weight:
- Euro (EUR): ~57.6%
- Japanese Yen (JPY): ~13.6%
- British Pound (GBP): ~11.9%
- Canadian Dollar (CAD): ~9.1%
- Swedish Krona (SEK): ~4.2%
- Swiss Franc (CHF): ~3.6%
Because the euro has the largest weight, moves in EUR/USD have the biggest impact on DXY.
Why Does DXY Matter?
DXY is widely followed because it affects many markets:
- Stocks: A strong dollar can hurt U.S. companies with overseas earnings
- Commodities: Since most are priced in dollars, a rising DXY often pressures oil, gold, and metals
- Bonds and rates: It reflects interest rate differences and demand for U.S. assets
- Risk sentiment: A stronger dollar often signals risk-off conditions
What Does DXY Going Up or Down Mean?
- Rising DXY: The dollar is strengthening
- Falling DXY: The dollar is weakening, which often supports commodities and risk assets
As a rough guide:
- Above 100 suggests a strong dollar
- Sustained moves below 95 often point to a downtrend
Key Historical Levels
- All-time high: ~164.7 in 1985
- Major low: ~70.7 in 2008
How Traders Use DXY
Traders and investors use DXY to:
- Identify broad market trends
- Confirm equity and commodity trades
- Gauge global liquidity
- Assess the impact of Federal Reserve policy
Estimated Probability Table
| Scenario | Description | Estimated Probability |
|---|---|---|
| Sideways consolidation | Holding 97–102 range | 40% |
| Bullish recovery | Break above 102 | 30% |
| Bearish continuation | Breakdown below 96 | 30% |
Fundamentals to Watch
The dollar index is still very sensitive to interest rate expectations and signals from the Federal Reserve. Inflation reports, job data, and Treasury yields continue to drive where the dollar goes. If markets change their view on when rate cuts will happen, the dollar could move quickly out of its current range.
Global factors also matter. Differences in economic growth, geopolitical events, and overall risk appetite can all affect demand for the dollar. With the index trading near key technical levels, upcoming economic data and central bank comments are likely to decide the next clear move.
This analysis is for educational and informational purposes only and does not constitute trading advice or a recommendation to buy or sell any financial instruments. Trading involves significant risk and may not be suitable for all investors. Always conduct your own research and consult with a licensed financial professional before making trading decisions.