


Introduction
Gold futures (GC) are trading near their all-time high once more as bulls have regained control over the yellow metal. Interest rates & real yields as well as rate cut expectations, are having a positive impact on the price for 2026. The US Dollar has also weakened, which, because Gold is priced in Dollars, is helping to drive the price upward.
Periods of high geopolitical tension and financial instability increase demand for gold as a trusted store of value, independent of any government or financial system. As global conflicts and strategic rivalries remain elevated, this safe-haven bid is likely to continue providing underlying support for gold prices.
Market Structure & Trend
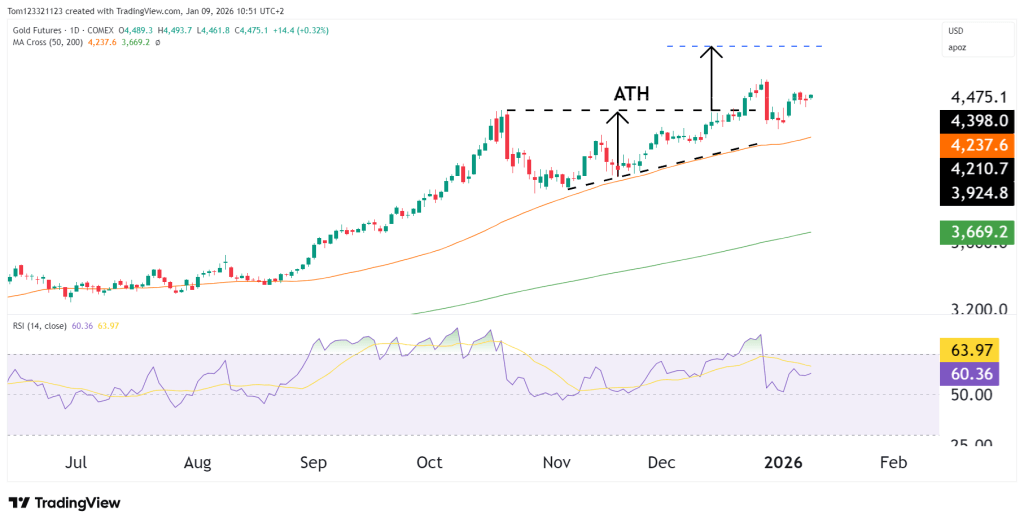
The broader structure remains firmly bullish. Gold has printed a series of higher highs and higher lows, with the former ATH now acting as a key support zone. Price is comfortably above both the 50-day and 200-day moving averages, confirming the strength of the trend.
The recent pullback was small after the price broke above the high, which was also forming an ascending triangle pattern. That pattern is pointing toward a price target of 4,782 (blue line on chart).
From here, as long as the 50-day moving average holds, the trend remains bullish. If broken to the downside, the next support level would be around $4,100.
Key Technical Levels
Resistance
- 4,500–4,520: Near-term upside extension and measured move target
- 4,600+: Psychological upside area if momentum accelerates
Support
- 4,390–4,400: Former all-time high and breakout level
- 4,230–4,250: 50-day moving average and trend support
- 3,920–3,950: Deeper support and prior consolidation area
Momentum (RSI)
The RSI has remained above 50 since September, showing the powerful momentum driving the yellow metals’ price action. The indicator remained in overbought territory for two months as well.
The Relative Strength Index (RSI) is a popular momentum indicator that shows whether an asset is overbought or oversold. Created by J. Welles Wilder Jr., RSI moves between 0 and 100 and is usually calculated over 14 periods by comparing recent gains to losses. An RSI above 70 signals overbought conditions, while below 30 suggests oversold conditions.
Technical Scenarios Ahead
- Bullish continuation:
Consolidation above the former ATH leads to another leg higher toward 4,500+. - Sideways consolidation:
Price ranges between 4,250 and 4,500 as momentum digests recent gains. - Deeper pullback:
A loss of 4,250 could open a move toward the lower support zone near 3,950.
Estimated Probability Scenarios
| Scenario | Description | Estimated Probability |
|---|---|---|
| Bullish continuation | Break and hold above 4,500 | 50% |
| Range consolidation | Holding above ATH | 30% |
| Deeper pullback | Move toward 4,000 area | 20% |
Fundamentals
Gold is staying strong because investors expect interest rates to fall, global tensions remain high, and many continue to buy gold as protection against inflation and weaker currencies. A weaker U.S. dollar and lower real bond yields have also supported prices.
In the short term, gold may move around based on U.S. inflation data, comments from the Federal Reserve, and changes in bond yields. Still, as long as real yields do not rise sharply, the overall outlook for gold remains positive.
This analysis is for educational and informational purposes only and does not constitute trading advice or a recommendation to buy or sell any futures contracts. Futures trading involves significant risk and may not be suitable for all investors. Always conduct your own research and consult with a licensed financial professional before making trading decisions.
