


Introduction
The S&P 500, along with all other US major markets, has staged an impressive rally this year. ES is likely to close near all-time highs, up 17% YTD. Easing inflation and Fed expectations have been the main drivers for the rally this year, as well as positive earnings from mega-cap stocks. As we come to the end of 2025, volatility could increase for a short period as investors and fund managers adjust their portfolios. Let’s take a look at the technicals and see what they are telling us.
Technical Analysis
Daily Chart
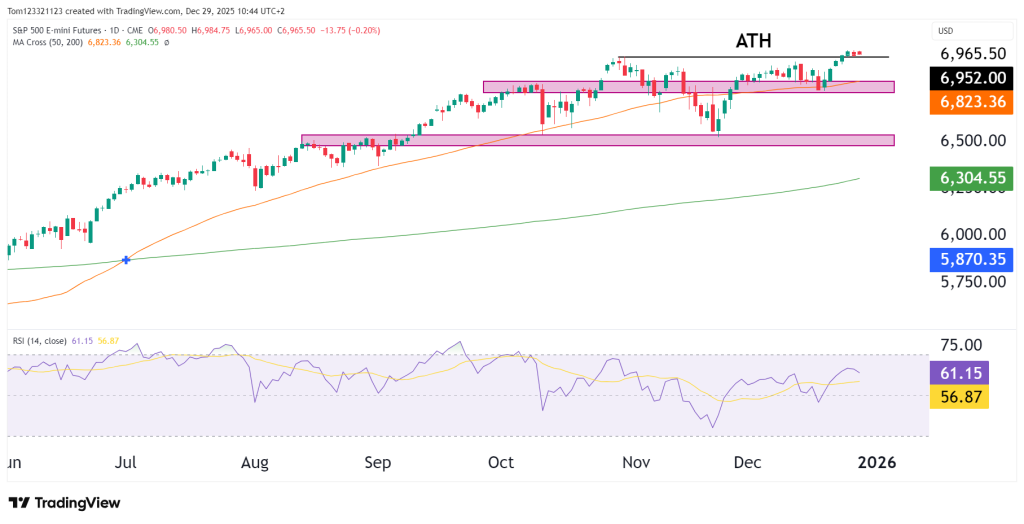
On the daily timeframe, ES is holding above the 50-day moving average near 6,823, which has acted as dynamic support during recent pullbacks. The 50 MA has been tested multiple times since September, and each time, except for one, it has acted as a strong support that held the price and sent it higher. The previously highlighted support zone around 6,650–6,700 remains intact and continues to be an important area where buyers have stepped in. Price has now reclaimed and held above this zone, reinforcing the bullish structure.
The market is currently pressing into the all-time high region near 6,950–6,970. RSI is holding in the low-60s, indicating positive momentum without reaching extreme overbought conditions.
Key Technical Levels
| Type | Level | Description |
|---|---|---|
| Resistance | 6,950–6,970 | All-time highs |
| Support 1 | ~6,820 | 50-day moving average |
| Support 2 | 6,650–6,700 | Prior resistance turned support |
| Support 3 | ~6,300 | 200-day moving average |
Estimated Probability Table (Next 2–3 Weeks)
| Scenario | Estimated Probability | Notes |
|---|---|---|
| Breakout above ATH | 45% | Trend intact |
| Sideways consolidation near highs | 40% | Digesting gains after strong rally |
| Deeper pullback toward 6,650 | 15% | Would require loss of 50-day MA |
Fundamentals to Watch
From a fundamental perspective, traders and investors are closely monitoring upcoming U.S. inflation data, including CPI and PCE, as these releases will shape expectations around the Federal Reserve’s policy path. Any signs that inflation is re-accelerating could pressure equities via higher rate expectations, while softer data may support the desire for risk.
In addition, upcoming FOMC communications, Treasury yield movements, and ongoing earnings updates from large-cap constituents remain key drivers.
This analysis is for educational and informational purposes only and does not constitute trading advice or a recommendation to buy or sell any futures contracts. Futures trading involves significant risk and may not be suitable for all investors. Always conduct your own research and consult with a licensed financial professional before making trading decisions.
