

Introduction
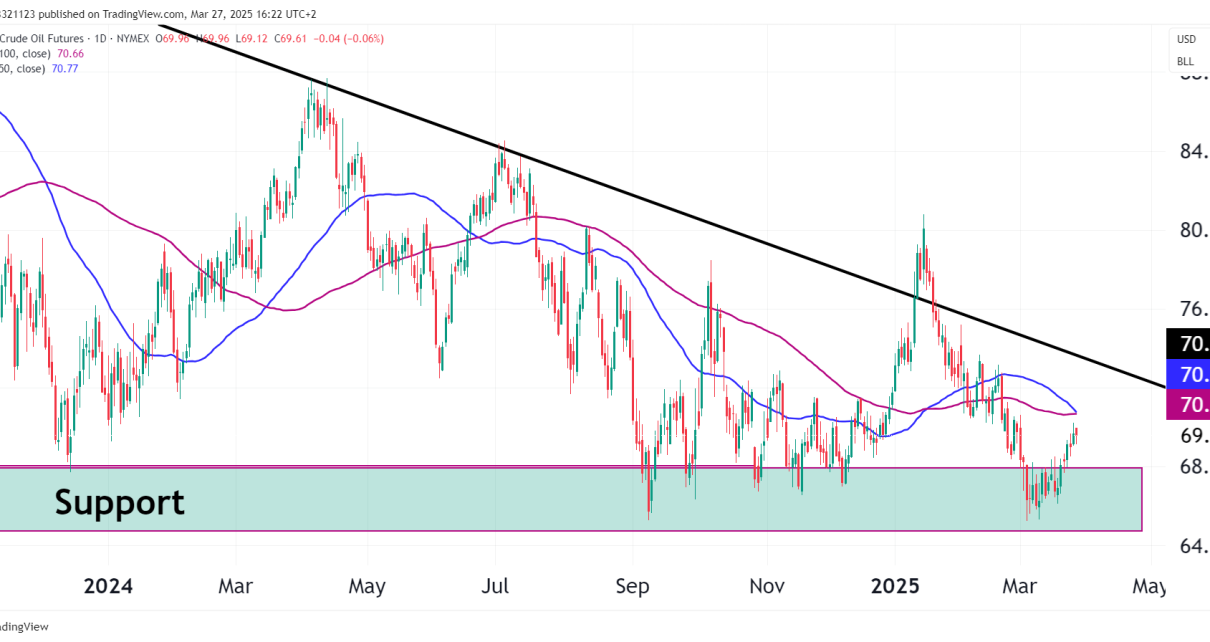
Crude oil futures (CL) continue their recovery from the long-term support zone, now approaching key technical levels that could determine the next major move. Given last week’s analysis, where we noted the importance of the $64–$67 support zone, price has followed through with a notable bounce. However, the downtrend structure remains intact, and crude is now approaching key areas of technical confluence that will dictate whether this recovery has legs.
Technical Overview
Support Zone Reaction
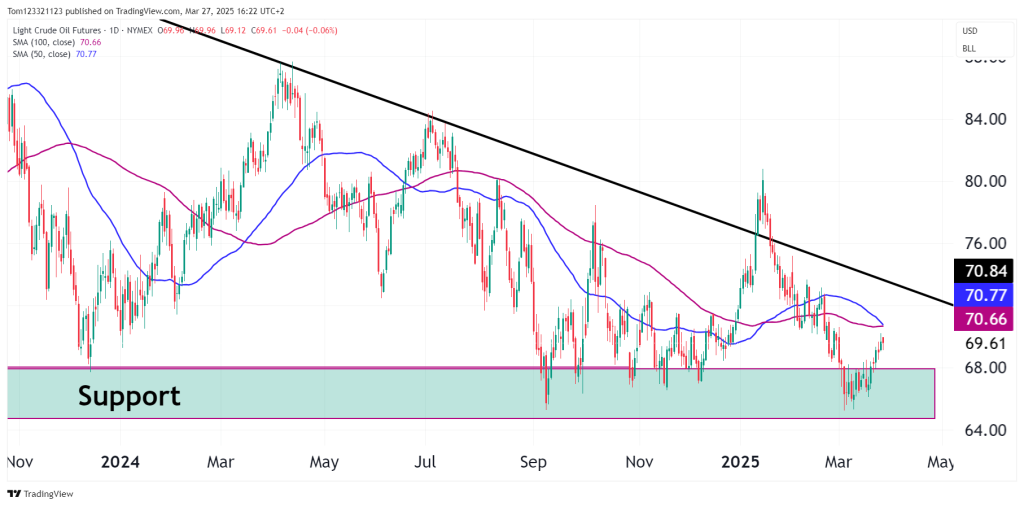
- CL tested the $64–$67 support area, a zone that has consistently provided strong demand over the past year. The bounce off this level was anticipated, and buyers have stepped in aggressively.
- Price has now climbed toward the $70–$71 region, where two significant technical hurdles exist:
- 50-day SMA at $70.77
- 100-day SMA at $70.66
Descending Trendline Resistance
- The long-term downtrend line from the 2023 highs is still intact and converges around $72–$73.
- If bulls push price higher, this trendline will be the next major battle zone.
Short-Term Momentum
- The 50-day SMA is crossing below the 100-day SMA, reinforcing the bearish bias.
- The rally has been sharp, meaning a pullback could come before any continuation higher.
Key Levels to Watch
| Level | Type | Significance |
|---|---|---|
| $64 – $67 | Support | Key demand zone, strong historical bounce area |
| $70 – $71 | Resistance | SMA confluence, initial supply zone |
| $72 – $73 | Major Resistance | Downtrend line, breakout level |
| $75+ | Bullish Breakout | Trend reversal confirmation |
Potential Scenarios
Bullish Breakout (Less Likely for Now)
- If oil breaks above $71 and holds, it could challenge the $72–$73 downtrend line.
- A confirmed breakout above $75 would shift sentiment bullish and open the door for higher prices.
- This scenario requires fundamental support, such as supply disruptions or renewed geopolitical tensions.
Bearish Rejection (Higher Probability)
- If price fails at $70–$71, expect a pullback toward $67 as sellers return.
- If this happens with increasing volume and a bearish daily close, a retest of $64 is possible.
- Oil remains in a downtrend, so rallies into resistance should be viewed cautiously unless momentum shifts.
Trend Continuation (If $64 Breaks)
- If support at $64 fails, it would confirm continued bearish pressure.
- Next major support is $60, with extended downside risk to $58–$56.
Trade Opportunities
Long Setup (Higher Risk – Countertrend)
- Entry: $68–$69 (on pullback)
- Stop-Loss: Below $67
- Target 1: $71
- Target 2: $73 (Trendline test)
Considerations: This is a countertrend trade, so risk should be carefully managed. A clear break above $71 improves the odds of hitting $73+.
Short Setup (Higher Probability – Trend Continuation)
- Entry: $70.50–$71.50 (rejection at SMA resistance)
- Stop-Loss: Above $73 (trendline breakout invalidation)
- Target 1: $67
- Target 2: $64 (Major support retest)
Considerations: A rejection candle or RSI failure around 50–55 would confirm selling pressure. A break below $67 would accelerate downside momentum.
Final Thoughts
CL has respected the support zone we identified last week, but it remains in a larger downtrend. The test of $70–$71 resistance will determine whether this bounce is a temporary correction or the start of a broader reversal.
- Short trades at resistance zones remain the higher-probability setup until we see confirmation of a trend change.
- Long trades are possible but require tight stops and clear bullish confirmation.
- Watch fundamental catalysts: OPEC supply moves, geopolitical risk, and US Dollar strength will influence oil’s next move.
Bearish bias remains intact unless CL breaks and holds above $73.

