

Introduction
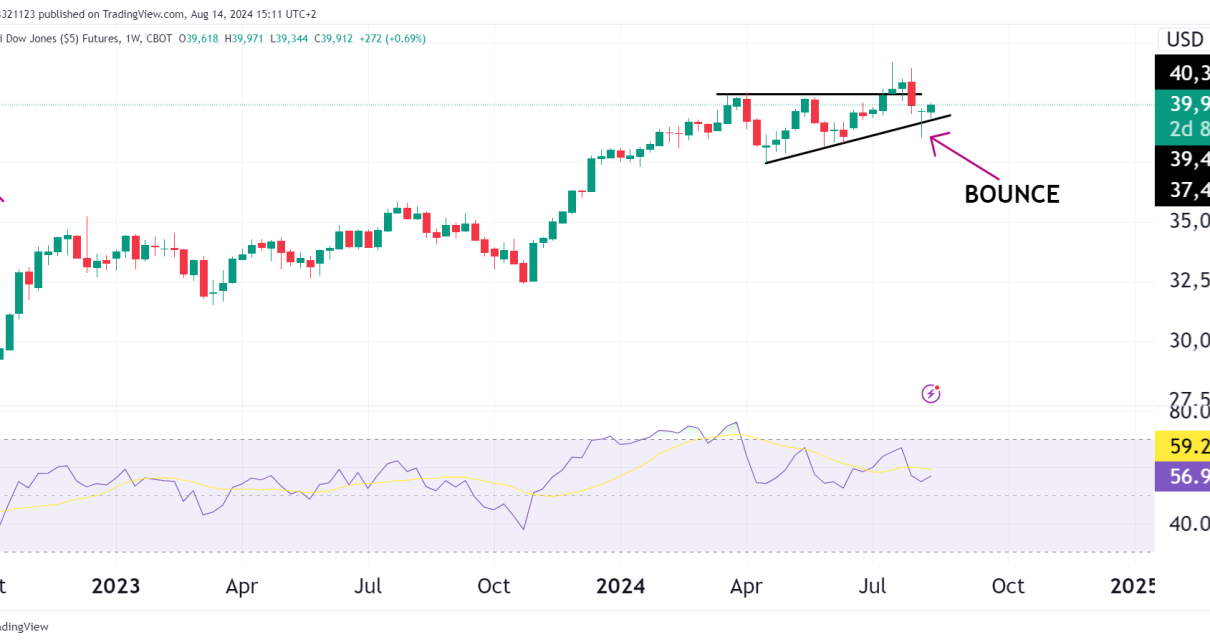
The Dow Jones has been in a tight ascending triangle on the weekly chart as all US indices continue to surge despite massive geopolitical tensions. At the moment, YM is bouncing off a low and could possibly look to be moving higher for the next few weeks. Lets take a look at the chart and see how we can position moving forward.
Weekly Chart
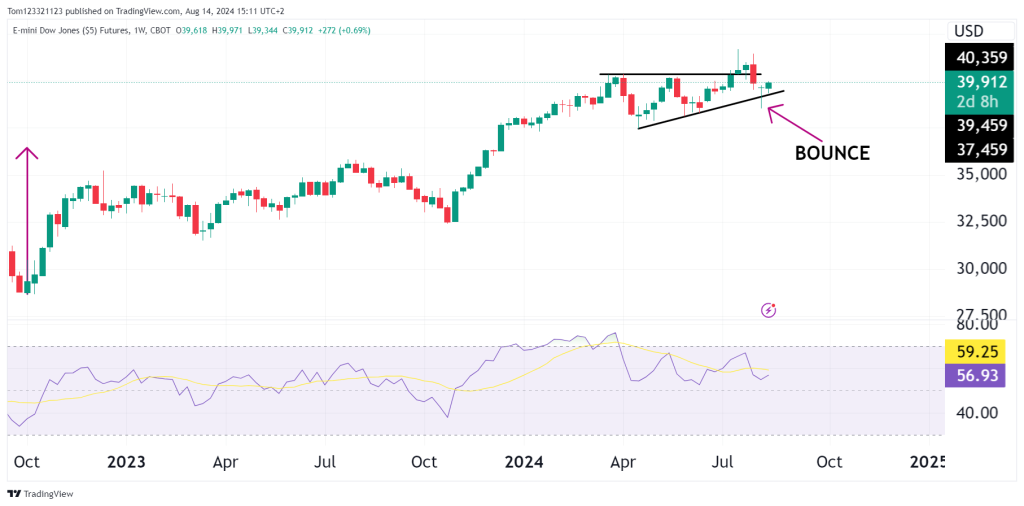
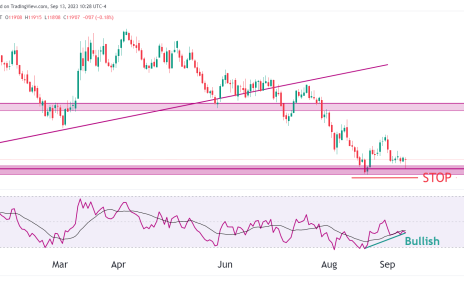
After the surge in price in YM since the start of 2024, there has been a consolidation period where price has moved sideways but an ascending triangle has formed. There are still higher lows which has the potential to lead to a break out in price above the resistance level.
Also, the weekly chart closed with a bullish morning star pattern from last week off the ascending triangle line. Bulls are hoping this week closes green to confirm that morning star and give more conviction to upward price movement.
Daily Chart
Trade Setups:
Bullish Continuation Setup:
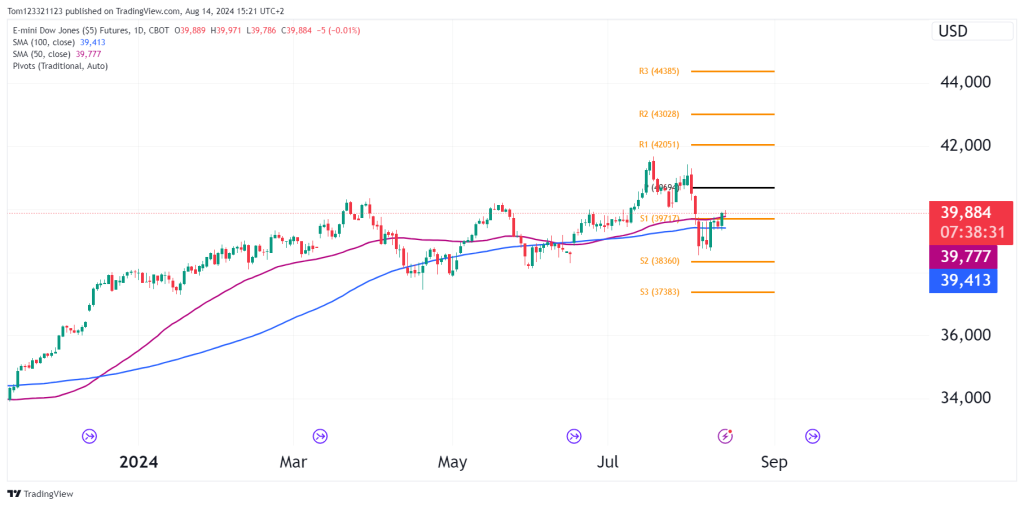
- Entry: A confirmed close above $40,964 (pivot point) could signal a bullish continuation. Traders could consider entering long positions if the price breaks and holds above this level.
- Stop Loss: Place a stop loss below $39,778 (50-day SMA) to protect against a false breakout.
- Target: The first target could be the R1 pivot level at $42,051. If the bullish momentum continues, the R2 pivot level at $43,028 could be the next target.
- Risk/Reward Ratio: Aim for a risk/reward ratio of 1:2 or better.
3. Range-Bound Play:
- Entry: Given the proximity of the price to both the 50-day and 100-day SMAs, there’s a possibility of the price remaining range-bound between $39,413 (100-day SMA) and $40,969 (resistance level).
- Stop Loss: Set a stop loss just outside the range, below $39,400 on the downside or above $41,000 on the upside.
- Target: For range-bound trades, target the opposite side of the range, $40,969 for long positions and $39,413 for short positions.
- Risk/Reward Ratio: Aim for a quick 1:1 to 1:1.5 risk/reward ratio, as range-bound trades tend to have tighter profit margins.
If you have any technical analysis or a great trade you took with an explanation of your process, please send it to us via our Instagram here or email [email protected] or [email protected]. The trader who sends the best analysis/trade that week will receive a 25% discount code to use on any Evaluation.
