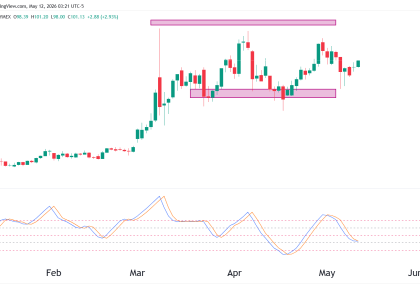
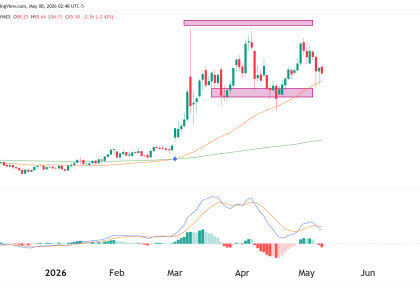
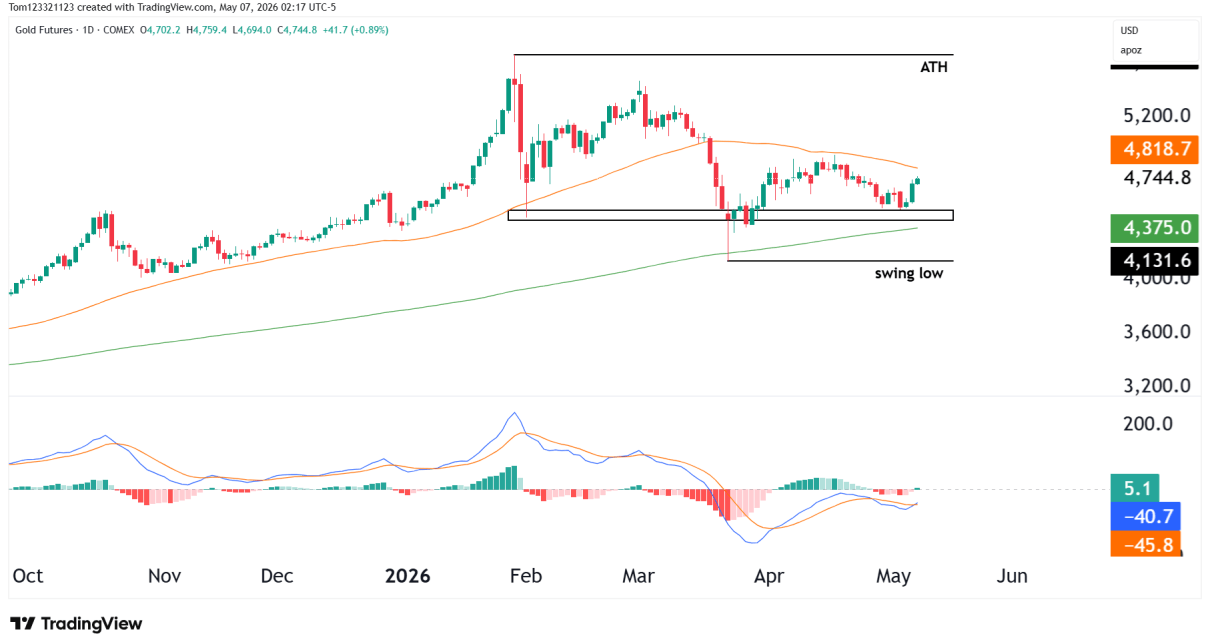
Weekly Chart Analysis for EURO FX Futures:The weekly chart shows price oscillating between a tight range of support and resistance. The Moving Average Convergence Divergence (MACD) is flat and close to the zero line, indicating a lack of strong momentum in either direction. The support zone around 1.05900 is critical, and a break below would Read More…
Tag: stock market
NASDAQ Futures (NQ) firmly bullish
Weekly Chart Analysis for NASDAQ 100 E-mini Futures:The weekly chart shows price in a clear ascending channel pattern, with NQ positioned in the upper half of the channel. The Relative Strength Index (RSI) is sitting in overbought territory, however. The all-time high (ATH) stands as the ultimate resistance level, which price has closed above in Read More…
Greyscale dumps Bitcoin; what now?
Weekly Chart Analysis: Price has formed a large rounding bottom pattern and parabolic curve, typically considered a bullish reversal signal. The price was approaching the all-time high (ATH) resistance zone, near $69,435, before swiftly pulling back after greyscale started dumping on the market. We should monitor this level closely; a decisive weekly close above the Read More…
Equities Rally as S&P 500 Hits Another Record High
On Monday, equities rallied as the S&P 500 set another record high, driven by gains in tech stocks. Meanwhile, investors awaited corporate reports for insights into this year’s profit outlook. Additionally, on Friday, the S&P 500 confirmed its bull market status since its low on October 12. Top tech companies like Microsoft and Apple will Read More…
Bulls in full control as S&P 500 (ES) Surges
Weekly Chart Analysis: The price of ES has made a significant move by closing above the all-time high (ATH), which suggests a strong bullish bias. We see a clear break above the previous resistance level, which bulls want to see serve as support in any potential retest. If you’re looking for a bullish confirmation of Read More…
Relative Strength Index (RSI) Indicator Explained
Introduction As a trader, having the right indicators in your toolbox can mean the difference between successful trades and costly mistakes. One of the most powerful and versatile tools available is the relative strength index (RSI indicator). Virtually every trader knows about the RSI, but are you using it to its full potential? In this Read More…