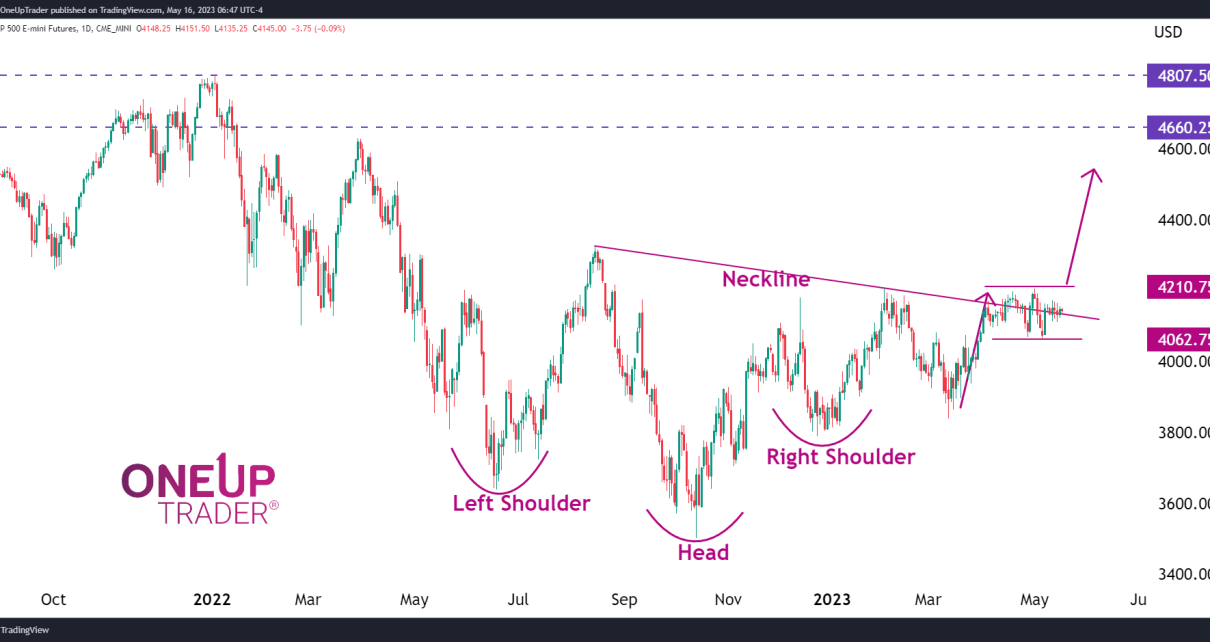
The weekly chart shows a bullish false-break candlestick formation. Analyzing the support/resistance band on the 4-Hourly chart. A look into the 1-Hourly trend channel. False Break Candle The false break candle strategy is one we are familiar with at OneUp Trader, and for a good reason – its reliability! The pattern works because when the Read More…
Tag: stock market
Parabolic Curve Retest and Inverse Head & Shoulders on Crude Oil (CL) Futures Chart
The parabolic curve on the CL chart continues to act as support. A Potential inverse Head & Shoulders formation on the 4-Hourly time frame. Point of control volume profile acting as resistance. Daily Chart Recap From last week’s multiple tests of the parabolic curve, CL is repeating the same tests once more, with the price Read More…
Crude Oil (CL) Futures Poised For a Bullish Breakout?
A recap of the Bullish Parabolic curve. CL looking more Bullish Potential targets of $90 & $93.64 are still probable. The Parabola The parabolic curve mentioned in last week’s analysis has been tested on five different sessions now, with each attempt being bought up, resulting in bullish candlestick formations on the daily chart. This indicates Read More…
Technical Analysis: Gold Futures (GC) Prices Bounce Off Minor Support
Gold Futures prices bounce off the minor support zone. The smaller time frames show many trade opportunities. The bearish sentiment remains. Quick Recap Last week, we mentioned the possibility of a bounce out of the minor support zone at $1,622.20-$1638.50 within the larger term downtrend. Take a look at the article here to get a Read More…
Gold Futures (GC) Analysis: Multi-Year Support Now Resistance
Multi-Year support level successfully holds as resistance. Is Gold oversold in the short term? Sell-off followed by consolidation pattern on the 4-hourly chart. Multi-Year Support Now Resistance If we rewind to last month, we watched gold break below the major support after holding for over two years. We stated that the level could turn into Read More…
Price Action Analysis: E-mini S&P 500 (ES) Futures
Price bounces off the Parabola. The Cup & Handle target has been hit. ES maintains its bearish outlook and potential targets to note. The Cup & Handle From Last Week Last week we reviewed the Cup and Handle Pattern on the 1 Hourly ES chart here. Target 1 was met as the price bounced off Read More…