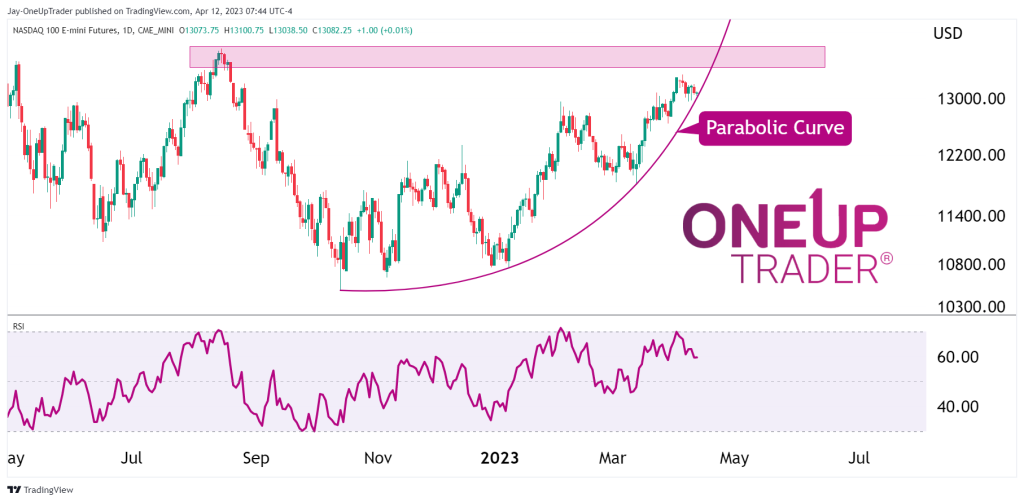
- Analyzing the continued bullish momentum with the RSI and a parabolic curve.
- There is a potential pullback area at $12,700 where bulls can add to their positions.
Technical analysis
Nasdaq futures have been showing a strong bullish momentum, as the price action continues to make higher highs and higher lows. Currently trading at $13,000, the next significant resistance level is at $13,700, which was a major resistance level in 2022.
The Relative Strength Index (RSI) is also supporting the bullish momentum, as there is no sign of bearish divergence yet. The RSI is a momentum indicator that measures the magnitude of recent price changes to evaluate overbought or oversold conditions. A bearish divergence occurs when the price makes a higher high but the RSI makes a lower high, indicating that the trend may be losing steam.
A parabolic curve can be seen on the daily chart. If it holds, the bullish case is a strong one.
However, a pullback to $12,700 is possible, which could be a potential area for bulls to add to their positions again. This level also coincides with a previous resistance level that could now act as support.