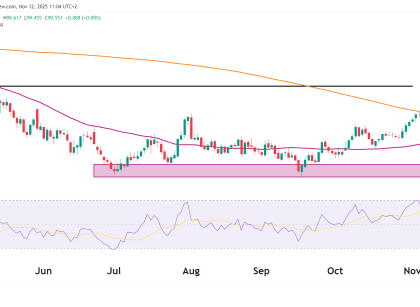
gold technical analysis
Technical Analysis

Gold Technical Analysis: Triangle Breakout, Eyes on $3,620

Chart Structure Symmetrical Triangle Previous Demand Zone Indicators RSI (14) Pivot Levels Level Description S1 $3,143 Key support/demand base Pivot $3,246 Inside triangle, base for breakout R1 $3,468 Initial resistance on breakout R2 $3,620 Primary measured target R3 $3,792 Stretch target if breakout is impulsive Market Context Trades Bullish Breakout Entry Failure Reversal Watch Bear/Bull Read More…

funded trader oneup trader
Funded Traders Funded Trading Interviews

From Freelancer to Funded Trader: How Nicholas Mastered Bond Futures with OneUp Trader

Introduction Nicholas Patterson from Opelika, Alabama, completed his OneUp Trader evaluation in just 15 days and has been steadily improving ever since. At 33, he works as a freelancer in film and music production while still developing his bond trading strategy. “I enjoy the flexibility that comes with making a profit from the markets,” Nicholas Read More…

crude oil technical analysis
Technical Analysis

Crude Oil Technical Analysis, 6 June 2025

Technical overview Support & Resistance Zone/Level Description R1 ($64.89) Near-term resistance; price now testing. R2 ($68.98) Strong resistance; top of the supply zone. S1 ($56.00) Major support from mid-April low. Pivot ($60.09) Previous consolidation base. Highlighted Supply Zone Momentum & RSI The recent move marks a clear bullish structure of higher lows and higher highs. Read More…

futures trading strategies for beginners
Technical Analysis

Bitcoin Technical Analysis, 5 June 2025

Trend Structure Key Support Levels Level Comment 102,720 (Pivot) Immediate short-term support; being tested. 95,095 (S1) Stronger horizontal 85,060 (S2) Lower support level of the channel uptrend. Resistance Levels Level Comment 110,150 (ATH) Psychological and technical ceiling. 113,755 (R1) Short-term price rejection zone. 122,380 (R2) Upside breakout target post-ATH. Market Psychology Trade Setups Scenario A Read More…

Fundamental Analysis

Equities Climb with Focus on US Trade Negotiations

Equities edged higher on Monday amid hopes of progress in trade talks between the US and its trading partners. However, there was downward pressure after Trump promised to increase tariffs on steel and aluminium goods.  On Friday, Trump called on the US’s trading partners to provide offers for negotiations by Wednesday. More talks could result Read More…

Technical Analysis

Russell 2000 Lagging S&P 500, Technical Outlook 3 June 2025

RTY Underperformance Weekly Chart of RTY: Structure and Trend Bullish Observations: Caution: Daily Chart of RTY Moving Averages RSI (14) Structure Metric ES (S&P 500 Futures) RTY (Russell 2000 Futures) Trend (Weekly) Strong uptrend Sideways, potential reversal Proximity to ATH ~4% below ATH ~17% below ATH Daily Trend Bullish continuation Range/consolidation RSI Momentum (Daily) Above Read More…