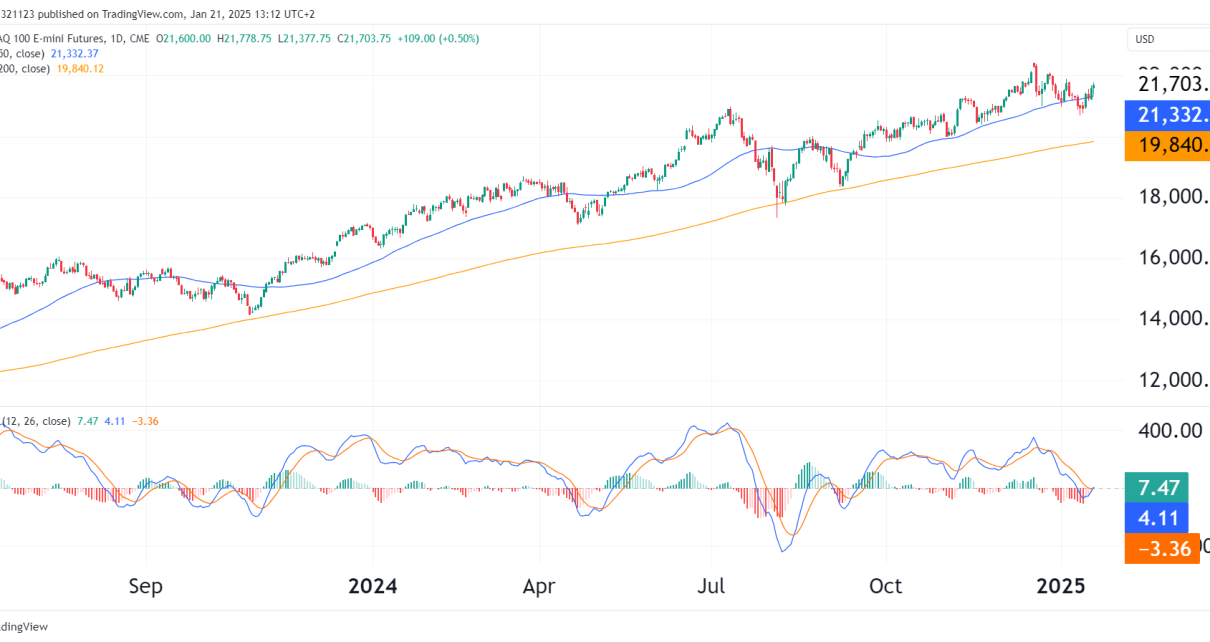
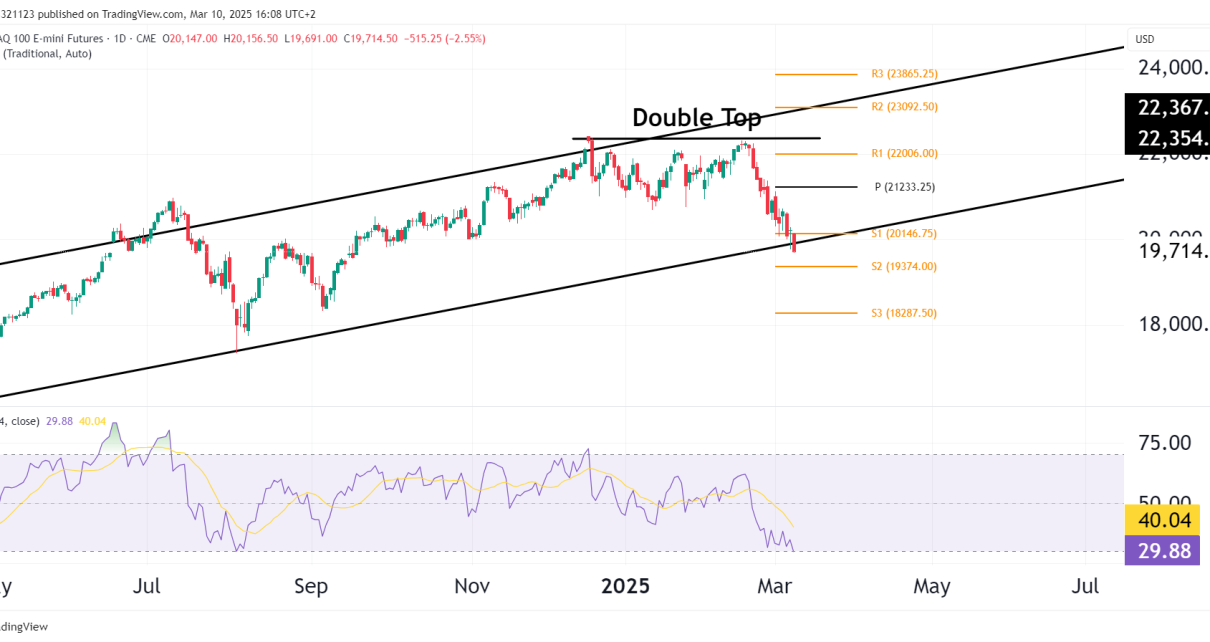
Overview and Market Sentiment:The NASDAQ 100 futures (NQ) have been in a strong long-term uptrend, gaining 22% for one year, but the recent pullback is raising caution among traders. The daily chart shows a technical retracement after reaching an All-Time High (ATH) earlier in the summer, and now the price is testing key support levels. Read More…
Tag: Nasdaq 100 futures
NASDAQ Futures (NQ) Surge Incoming?
Price Action and Trend NQ, like all other equity markets, has been in a strong uptrend since October 2023. However, we’ve recently seen a sharp pullback from the all-time high of around 20,983.00, and now could be the time to look to take long positions. Support and Resistance Moving Averages The price is currently between Read More…
NASDAQ Futures (NQ) Bearish Divergence?
Introduction The Nasdaq 100 futures are currently trading around 18,876.75. Over the past month, the index experienced a gain of approximately 5.76% since late April (Barchart.com). This performance is driven by strong corporate earnings from major tech companies like Nvidia and Microsoft, which have posted better-than-expected results. Nvidia’s surge of 9% following earnings and optimistic Read More…
Nasdaq Futures Jump as NVIDIA reports earnings
Nasdaq futures jumped approximately 2% Thursday morning following a strong earnings report from Nvidia, a leader in AI chip design. The company exceeded Q4 revenue expectations and projected Q1 revenue to triple, fueled by robust demand for its artificial intelligence chips. In premarket activity, Nvidia shares skyrocketed 12.9%, poised to add over $200 billion to its market Read More…
Nasdaq Futures (NQ) Pause At Resistance Level
Weekly Chart The weekly chart has seen 5 green weeks in a row, but this week has started off differently as NQ price rallied into a resistance zone at $15931, and price immediately began to sell off. Last week’s spinning top close is also a worry for the Bulls, but they will hope it is Read More…
How the Dow Jones Futures (YM) have diverged from the rest of the market
Breaking down how the dow jones diverged from other market indices last year. Analyzing the symmetrical triangle formation on the daily time frame. A true story about a trader who turned $5,000 into $15,000,000 in seven years. Quick Breakdown The Dow has been trading sideways for the majority of this year, remaining unchanged so far. Read More…