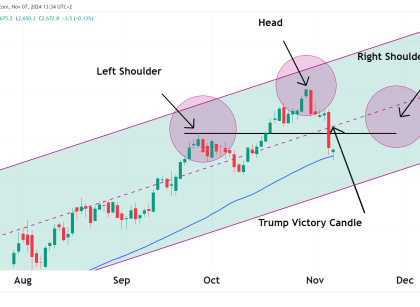
Weekly Chart Starting with the weekly chart, the Gaussian channel is signaling a bearish trend as the price is trading below the midline of the channel. This can be interpreted as a downward pressure on the price. The Gaussian also turned red in the middle of 2021 and has been that way since. The current Read More…
Tag: futures trading
Equities in Europe and Wall Street Slide Amid Rate Cut Uncertainty
Equities in Europe and Wall Street dropped on Tuesday, accompanied by a decline in US government debt. This drop reflects reduced market optimism regarding prompt Fed interest rate cuts. Equities and bonds (Source: Bloomberg) Meanwhile, the dollar surged against major currencies as the yield on the 10-year Treasury note increased. This also signaled reduced expectations Read More…
Crude Oil Futures (CL) levels and trades
In this week’s technical analysis of Crude Oil we will look at the weekly and daily charts. CL is down 26% since its 2023 peak made in September of last year and is currently trading inside of a support zone. Let’s see what the charts say and if we can find some opportunities. Weekly Chart Read More…
Equities Edge Down After a Strong Year-End Rally
US equities ended Friday slightly lower, closing a solid year-end rally as investors anticipated Fed rate cuts in the year ahead. S&P 500 weekly performance (Source: Bloomberg) Equities have risen strongly in the last months of the year. The S&P 500, the Dow, and the Nasdaq recorded nine consecutive weeks of gains. For the S&P Read More…
Gold Futures (GC) approaches ATH again
After gold made an all-time high a few weeks ago, the yellow metal sold off, and the chart turned bearish very quickly. The bulls will be happy to see that the selling pressure has softened and a new rally has begun. GC is now getting very close to the previous all-time high, where we saw Read More…
Japanese Yen Futures (6J) Technical Analysis
The Dollar is weakening, and we are seeing a resurgence in currencies like the Yen. In this week’s technical analysis, we look at the weekly and daily time frames, indicators, and levels to watch. Weekly Chart: Daily Chart: Trade Ideas: Key Levels to Watch:

