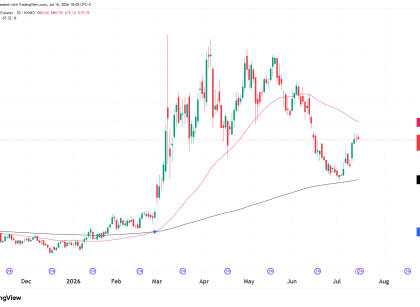
Introduction The dollar is still trading inside a broad range, but the recent price action is starting to lean weaker after the ceasefire in the Middle East. After pushing up toward the 100–101 area, DXY has failed to hold those gains and is now drifting back lower. This is the same zone that has acted Read More…
Tag: futures trader
Gold Rallies as US-Iran Reach a Ceasefire Deal
Gold rebounded on Wednesday after Trump agreed to a two-week ceasefire. This put a brief pause to the war between the US and Iran. The news came as a relief to investors who were worried about rising oil prices. Meanwhile, market participants eagerly await US inflation data due on Friday. In the previous sessions, gold Read More…
Crude Oil (CL) Technicals Post Cease Fire In Middle East
Introduction Crude oil has shifted quickly from a clean uptrend into a sharp corrective move, with price dropping roughly 15% following news of a ceasefire in the Middle East. The Strait of Hormuz has been open for two weeks, allowing the Oil ships to exit and enter the region. This has given some hope to Read More…
The Ultimate Beginner’s Guide to Moving Average Strategies
Introduction A moving average is a widely used indicator in technical analysis that helps smooth out price action by filtering out the “noise” caused by random price fluctuations. It is considered a trend-following, or lagging, indicator because it is based on past price data rather than predicting future movements. The two most common types of Read More…
Equities Rebound Continues Amid Upbeat Data, US-Iran Negotiations
Equities ended higher on Monday, continuing last week’s rebound from this year’s lows. The rebound came amid better-than-expected US data and optimism about progress in talks between the US and Iran. Meanwhile, market participants are awaiting US inflation figures for clues on future Fed policy decisions. Last week, the US released upbeat economic data, including Read More…
Gold Futures (GC) Technical Analysis 7 April 2026
Introduction Gold finally had a retracement since the record-breaking rally started in February of 2024. The pullback was 27% from its high in January, but the 200-day moving average held its line. A bullish candle formed on the day the price tested that moving average and bounced. The key event was the breakdown from the Read More…


