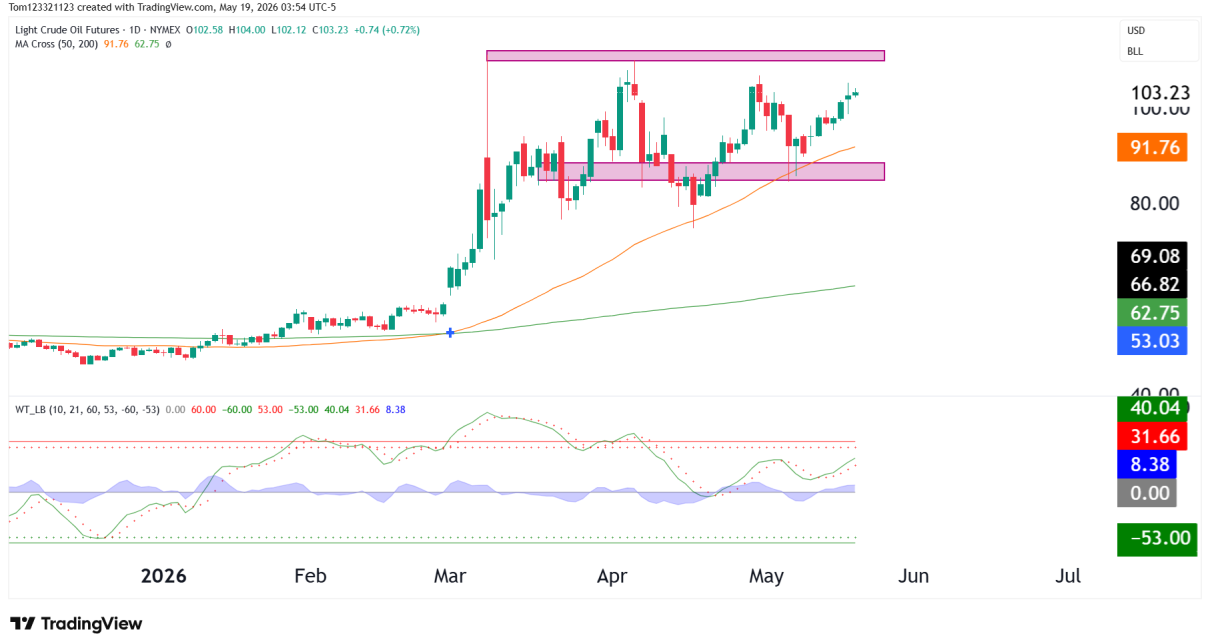
Strategies Trading Tips

Scalp Trading vs Day Trading Strategies

Introduction to Scalp Trading and Day Trading Scalp trading and day trading are two prominent trading strategies with very distinct approaches. Scalp trading involves making many trades in a single day to capture small price movements. It requires close market monitoring and high precision. Day trading refers to buying and selling financial instruments within the Read More…

Crude Oil Futures
Fundamental Analysis

Surprising Crude Draw Sends Oil Prices Soaring by 1%

On Wednesday, oil prices increased by approximately 1%, driven by a larger-than-expected decline in US crude inventories. Other factors that supported the rally include a decline in US crude output, Chinese economic stimulus, geopolitical tensions, and a weakening dollar.  China’s central bank plans to reduce the reserve requirements for banks starting from February 5, aiming Read More…

Nasdaq 100 index futures (NQ)
Technical Analysis

NASDAQ Futures (NQ) firmly bullish

Weekly Chart Analysis for NASDAQ 100 E-mini Futures:The weekly chart shows price in a clear ascending channel pattern, with NQ positioned in the upper half of the channel. The Relative Strength Index (RSI) is sitting in overbought territory, however. The all-time high (ATH) stands as the ultimate resistance level, which price has closed above in Read More…

futures trading strategies for beginners
Technical Analysis

Greyscale dumps Bitcoin; what now?

Weekly Chart Analysis: Price has formed a large rounding bottom pattern and parabolic curve, typically considered a bullish reversal signal. The price was approaching the all-time high (ATH) resistance zone, near $69,435, before swiftly pulling back after greyscale started dumping on the market. We should monitor this level closely; a decisive weekly close above the Read More…

Crude Oil Futures
Technical Analysis

Crude Oil Futures (CL) quickly turning bullish

Weekly Chart Analysis: Looking at the weekly chart, we observe that Light Crude Oil Futures have recently bounced off a consolidation zone around the $74.88 level, indicating a potential bullish breakout. Last week’s candlestick closed above this zone, and this week’s candle is turning green already. A sustained hold above $74.00 could see us targeting Read More…

E-mini S&P 500 (ES) futures
Technical Analysis

Bulls in full control as S&P 500 (ES) Surges

Weekly Chart Analysis: The price of ES has made a significant move by closing above the all-time high (ATH), which suggests a strong bullish bias. We see a clear break above the previous resistance level, which bulls want to see serve as support in any potential retest. If you’re looking for a bullish confirmation of Read More…