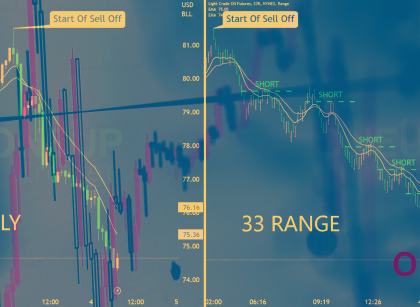
A look at the 2021 high that is a significant support and resistance level The RSI remains bearish with no signs of a reversal Potential bearish targets from 1-2-3 reversal and trend channel analysis Long Term Outlook We have been tracking the CL price for some time now as we watch the daily trend continue Read More…
Tag: Crude oil (CL) futures
Crude Oil (CL) Futures: Price Action Analysis
Bears take over as CL’s price drops 12% in a week. The hourly chart shows the potential of a double-bottom formation. Bears Take Over In Monday’s article, we discussed two possible scenarios, the Bear case and the Bull case. Since then, CL has dropped 12% and has taken out the spinning top’s low. CL is Read More…
1-2-3 Reversal Pattern Back On The Cards For Crude Oil (CL) Futures
The long-term 1-2-3 reversal targets are back on the cards Short opportunities on the 30-minute chart. The 1-2-3 Reversal Pattern We must go back to September to view our analysis of the 1-2-3 reversal. Since the market has now broken below recent lows, the bearish target is in play. You can view that article here. Read More…
Crude Oil (CL) Futures Forms a Dragonfly Doji On Parabolic Curve
A powerful Dragonfly Doji was formed during yesterday’s volatile session. CL prices bounce off of the Parabolic curve mentioned last Friday. What to expect next? The Parabolic Curve Acts as a Support In yesterday’s volatile session, CL dropped over 6% right into the support zone and the parabolic curve we mentioned in Friday’s technical analysis. Read More…
Technical Analysis: Crude Oil (CL) Futures Prices Consolidating
A Parabolic channel has been identified on the Daily Chart. CL is trading off a support zone at $81.40. Important note on stop placement. Chart Analysis Recap The Head & Shoulders pattern referenced in our CL chart analysis on November 7 did not confirm. The neckline acted as a barricade that the bulls could not Read More…
Technical Analysis – Crude Oil (CL) Futures Prices Continue to Rally
CL prices continue to follow the Parabola. The Inverse Head & Shoulders pattern has a chance as the price hovers above the neckline. Technicals point toward a bullish sentiment. Fibonacci analysis and targets if the rally continues. Quick Recap In the previous two articles, the central theme has been the bullish sentiment of CL, mainly Read More…


