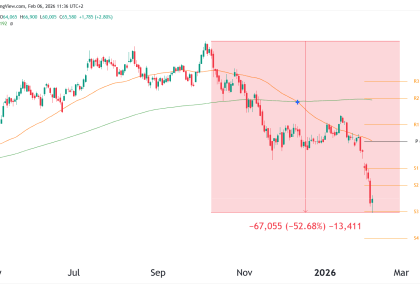
Trend Structure Key Support Levels Level Comment 102,720 (Pivot) Immediate short-term support; being tested. 95,095 (S1) Stronger horizontal 85,060 (S2) Lower support level of the channel uptrend. Resistance Levels Level Comment 110,150 (ATH) Psychological and technical ceiling. 113,755 (R1) Short-term price rejection zone. 122,380 (R2) Upside breakout target post-ATH. Market Psychology Trade Setups Scenario A Read More…
Tag: btc
Bitcoin Hits All-Time High: Technicals (BTC Futures)
Chart Context Bitcoin has exploded through its previous all-time high. The price is now above the psychological and technical resistance at $110,150. The breakout confirms the continuation of the uptrend after a 32% pullback, which lasted four months. Technical Analysis ATH Breakout Confirmed RSI at 74.76 – Overbought, but Not Diverging Support Zones Next Price Read More…
Bitcoin Futures (BTC) Technical Analysis – April 22, 2025
Technical Analysis Bitcoin has spent the past several weeks grinding out a bottom, forming a rounded base pattern just above the critical 78,000–80,000 support. This basing action has been healthy — no panic selling, rising volume, and a higher low structure formed. BTC is breaking above the key 87,000 level and testing the upper edge Read More…
Is the Bitcoin Bull Market Back?
Introduction Asset: Bitcoin (BTC/USD)Timeframe: DailyDate: April 10, 2025Current Price: $82,000Focus: Is the consolidation phase ending? Are new highs next? Market Context Bitcoin is showing strong signs that the multi-week correction may be behind us. After cooling off from an all-time high of $110,000, BTC entered a healthy consolidation phase — one that now appears to Read More…
Bitcoin Surges above $52,000; Upside Expected
Weekly Chart The weekly time frame shows that price is approaching the previous all-time high, a big milestone for Bitty. The swing high extensions (Swing:SH Ext at 32165) serve as a reference point for potential resistance on further moves up. This swing indicator will likely print a higher low soon around $40,000. Key Levels to Read More…
Greyscale dumps Bitcoin; what now?
Weekly Chart Analysis: Price has formed a large rounding bottom pattern and parabolic curve, typically considered a bullish reversal signal. The price was approaching the all-time high (ATH) resistance zone, near $69,435, before swiftly pulling back after greyscale started dumping on the market. We should monitor this level closely; a decisive weekly close above the Read More…


