


- Investors scramble for safety as central banks battle rising inflation with tighter monetary policies.
- This week has seen a rise in interest rates worldwide.
- The next target for bulls is 1880.00 in the charts.
Gold futures (GC) prices closed higher on Thursday and have started pushing higher after a pullback on Friday. This move was due to the collapse of world stocks, headed for their worst week since the collapse in March 2020, caused by the pandemic. Investors are concerned about the global economic outlook as central banks battle rising inflation.
The US had its most significant rate hike since 1994, Switzerland raised rates for the first time in 15 years, Britain raised rates for the fifth time since December, and the ECB is following closely behind. All this turmoil in the global economy has seen investors run away from riskier assets toward safe-haven assets like yellow metal.
The Bank of Japan was the only dovish central bank in a week where hawks raised the price of money worldwide.
“The more aggressive stance by central banks adds to headwinds for economic growth and equities. The risks of a recession are rising while achieving a soft landing for the US economy appears increasingly challenging,” said Mark Haefele, Chief Investment Officer at UBS Global Wealth Management.
Bank of America analysts released data showing leading stock markets were “painfully oversold.” Gold futures prices were also boosted by the soft economic data from the US yesterday that saw the dollar push lower.
Gold Futures technical forecast:
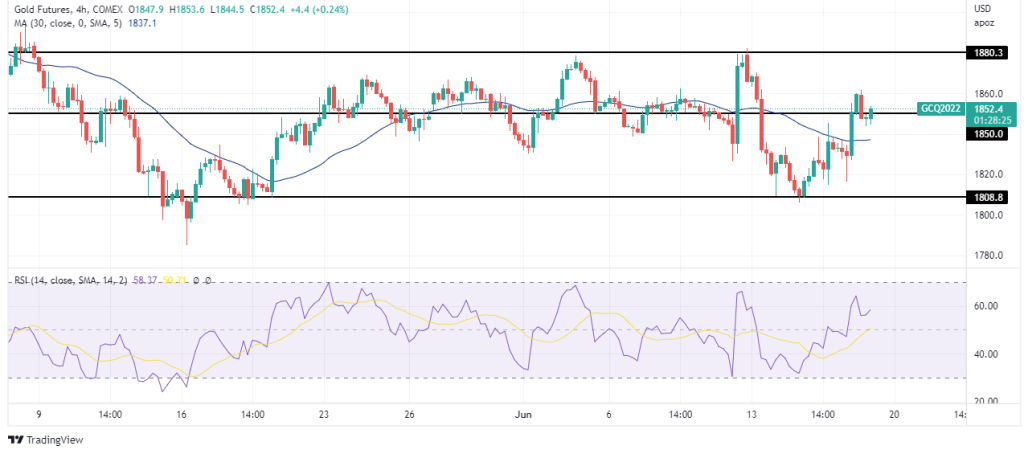
Looking at the 4-hour chart, we see that the price of gold futures is pushing higher despite being stuck in a larger range. The price has been chopping through the 30-SMA for some time, showing indecision in the market. The fact that the price currently trades above the SMA shows control by bulls.
RSI is trading above 50, also favoring bullish momentum. If RSI can push to the overbought region, it would signify strong bullish momentum needed to break the range resistance at 1880.00. A break of this level would lead to a higher high and could begin a bullish trend. However, if the price cannot break above 1880.00, we could see a return to range support at around 1808.00.

