

- US corporate earnings are under threat from rising inflation.
- Falling profit expectations could mean further downside potential for S&P 500 E-mini futures.
- The price could be headed for 3650.00 on the charts.
The E-mini S&P 500 (ES) is pushing lower on Thursday over growth concerns in the US, fueled by the Federal Reserve’s move to tighten its monetary policy.
Concerns are growing that inflation is a threat to US corporate earnings. This, coupled with a strong dollar and rising interest rates, adds more worries for investors already suffering from the S&P 500’s bear market confirmation earlier in the week.
As of Friday, Wall Street analysts expected a rise in S&P 500 earnings by 9.6% in 2022, up from 8.8% in early April and 8.4% on January 1.
As will be seen in consensus profit growth estimates, many analysts expect more negative outlooks from US companies in the coming weeks. This poor outlook indicates that the economy is in bad shape and at a high risk of recession.
Most S&P 500 companies will report second-quarter earnings after mid-July, and Microsoft and Target have been among the companies issuing poor outlooks in recent weeks.
“Estimates are too high, and you’ll see them start to come down as the second-quarter numbers come out and as companies talk about what they’re seeing,” said Peter Tuz, president of Chase Investment Counsel.
Falling profit expectations could mean more downside potential for a market that has been hit by worries over how an aggressive Federal Reserve response to rising inflation could affect growth.
The S&P 500 futures finished Monday over 20% below its record closing high, confirming the new bear market. The drop comes after stronger-than-expected inflation data last week that fueled expectations for a 75bps rate hike to control consumer prices.
E-mini S&P 500 (ES) Futures technical forecast:
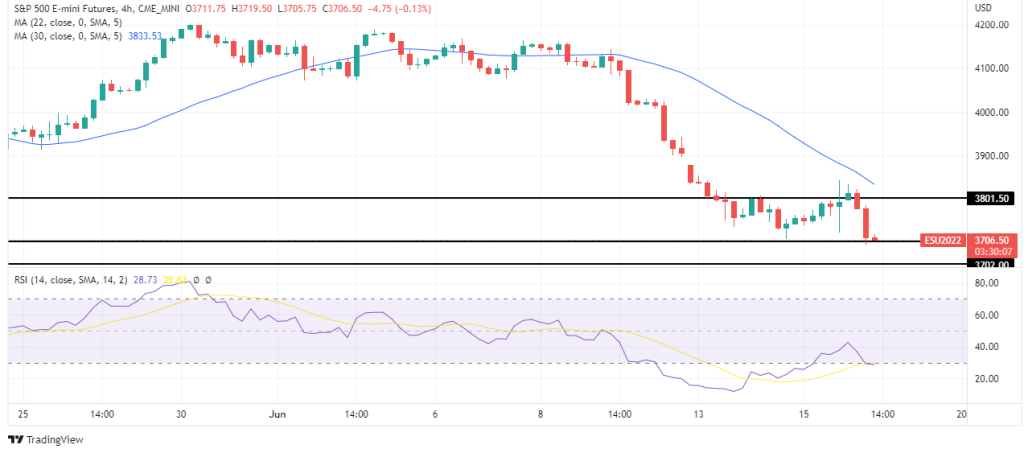
The 4-hour chart continues the bearish trend with a strong candle that has hit 3700.00. This move came after bulls pulled the price back to 3800.00, which was firmly rejected. The next thing for bears is to break below 3700.00 and push to 3650.00, making a lower low. RSI is trading well below 50, further confirming the bear market.