

Richard Wyckoff developed his trading method in the 1930’s. He based a lot of his philosophies on successful traders like Jesse Livermore. When it comes to studying Wyckoff’s methods, you will need to take your time and understand that they are very specific. If you are a beginner, take it slow and ensure you test it first in a simulated environment.
Wyckoff’s research led him to develop the following trading techniques and theories:
- Three fundamental laws;
- The Composite Man concept;
- A methodology for analyzing charts (Wyckoff’s Schematics);
- A five-step approach to the market.
Supply and Demand
This is one of the most basic laws of financial markets but it is essential for us to understand. If demand is greater than supply, we see prices rise and vice versa.
Cause and Effect
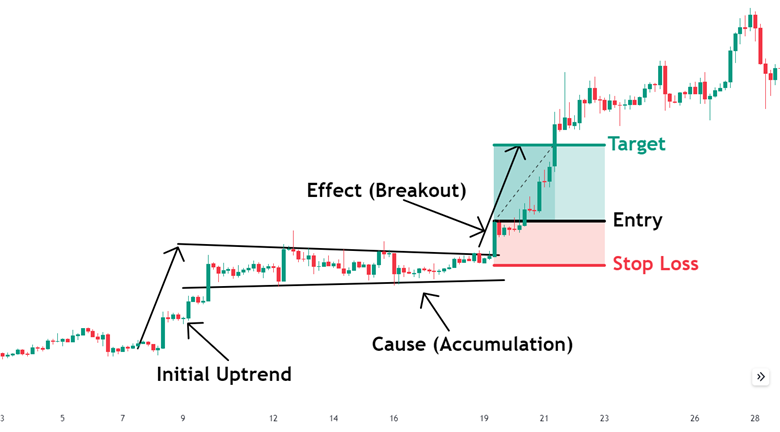
According to the second law, supply and demand differences are not arbitrary. Instead, they occur as a result of particular events following periods of preparation. According to Wyckoff, an uptrend (effect) eventually results from an accumulation phase (cause). On the other hand, a distribution phase (cause) eventually leads to a downtrend (effect).
Wyckoff used a novel charting method to determine what potential effects might result from a cause. He developed strategies for establishing trading targets based on the times of accumulation and distribution, to put it another way. This enabled him to calculate the likely length of a market trend after it emerged from a trading range (TR) or consolidation zone.
Look at the chart below for an example of the causal phase and the effect phase, according to Wyckoff. Using his methods, he would study the chart as a whole entity instead of individual people. The cause is the period of accumulation. The break out is the effect of price being stuck in a range for a period of time, coiling up like a spring before eventually breaking out.
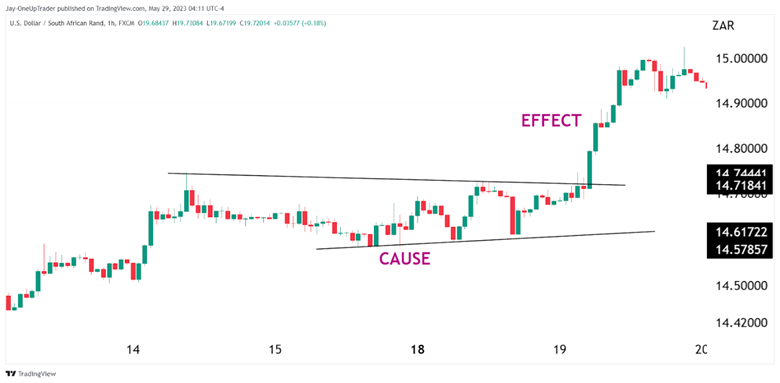
For the normal person, what we see is a simple consolidation phase with a breakout. For Wyckoff however, what he saw was something deeper. He attempted to understand the market dynamics and psychology deeply, which is why he would see the effect of the breakout must have been caused by something, and that is the consolidation phase in this case.
The Law of Effort vs Result
According to the third Wyckoff law, the trading volume serves as a proxy for the effort that results in price changes for an asset. There is a good chance the trend will continue if the price action and volume are in sync. However, if the volume and price significantly diverge, the market trend is likely to halt or reverse.
Consider the following: after a lengthy bearish trend, the market begins to consolidate with a very high volume. High volume indicates a significant effort, but sideways movement (low volatility) indicates a modest outcome. Therefore, a lot of that instrument is being traded, but there have been no further significant price drops. Such a scenario might point to the end of the downtrend and the impending reversal.
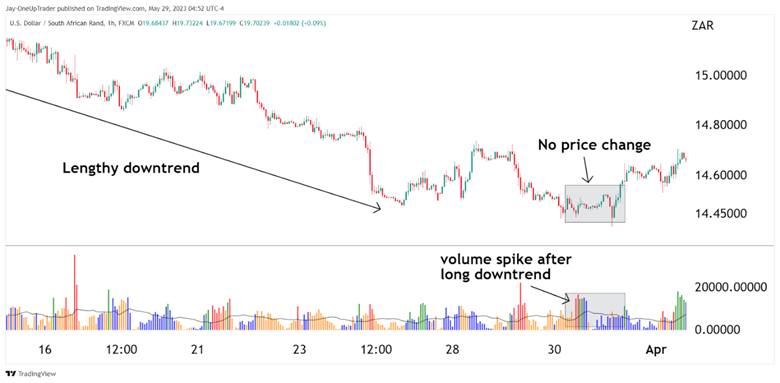
The chart above shows a lengthy downtrend. Look at the volume spike that I marked off; it comes after a lengthy downtrend, and there is no significant price movement. If we see the spike in volume and then a continued downward push, we can say the trend is likely to continue, but because we see the spike in volume and price remains sideways, which, according to Wyckoff, indicates that there is a significant effort happening, be it buying or selling does not matter that much. The fact is that there are a lot of securities being traded, but the price is not changing much at all. Since this happens AFTER a downtrend, it’s a sign that the market’s selling power is dwindling, and even after a significant effort (high volume) has occurred, it’s a signal that the trend is going to reverse.
Wyckoff’s Schematics
This is a very popular aspect of Wyckoff’s theories. It is advanced, which is why I stated earlier it is best to take it slow. I needed to include it however, because of the tremendous value it can give a trader.
Wyckoff’s schematics break down the accumulation and distribution phase of an instrument into smaller sections. They are divided into 5 phases. (A-E), see the chart below.
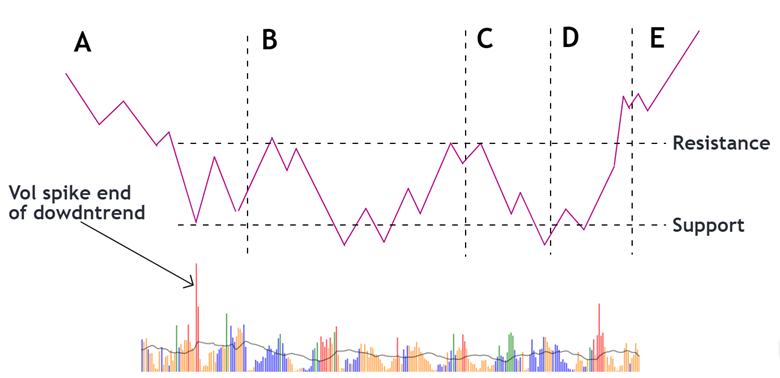
Phase A
The selling acceleration has a climax usually marked by a spike in volume as traders begin to capitulate. This essentially is the time of maximum pain and panic, which leads traders and investors to dump their contracts out of fear, causing a huge spike in volume. The large drop usually leads to a jump in the price as buyers board the extra supply. This is not a time to buy because we do not know how long the panic will last. This leads us to the next phase.
Phase B
This is the cause phase, according to Wyckoff, and is the lead-up to an effect, which will be the breakout/reversal move. Price forms a resistance band and a support band too within which it bounces. In some cases, we see what is called a bear trap, where prices pierce below the support line (bear trap) or above the support line and reverse (bull trap). This phase for Wyckoff schematics is a period where traders can enter the market if they wish, it would be either after a bull or bear trap has formed. (See the chart below)
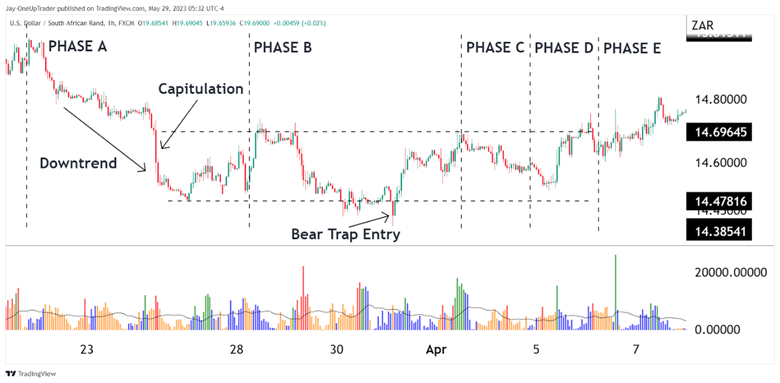
You can see in the chart above the different phases.
Phase C
This phase is normally the final bear trap, as shown in the chart above. This often acts as a spring and puts in the low, at least for the time being. The bear trap breaks the lower support level and stops traders out which leads to a ‘flash crash’ but not one that is very big. It is small but happens very quickly as the market makers search for liquidity. Since stop losses are market orders, traders agree to sell for less than where they set their order if need be.
Sometimes the spring does not occur, but it does not mean the schematics method becomes invalid. The spring just gives us a confident low to place stops underneath and enter into the market with a long trade.
Phase D
This phase is the transition between the causal phase (C) and the effect phase (reversal/breakout). This phase can generally be seen with high volume. The price will fall toward the lows of the accumulation zone between phases (B) – (D) before rallying and reversing. This can also become an entry point for traders who want to get in for a longer-term move after there has been an ample amount of consolidation.
Phase E
This is the final phase and is marked off by a reversal in trend. Traders who have entered into a long can now enjoy watching the market take off in their direction.
Summary
The above phases are broken down into accumulation, uptrend, distribution, and downtrend (more on this below the composite man section). During the accumulation phases, traders can enter into the market during bear or bull traps. Traders can also enter into the market in phase D once the market drifts lower, attempting to break below the low in phase B or C.
Composite Man
Wyckoff taught that we should view the market as being controlled by a single entity that was much larger than the retailers. He felt this would make it easier for us to go along with trends and market moves.
The majority of retail investors, whom Wyckoff frequently saw losing money, behave in the exact opposite way to The Composite Man. Wyckoff asserts, however, that the Composite Man adopts a tactic that is somewhat predictable and that investors can benefit from.
The composite man purchases assets before most investors do. He is powerful and has the ability to turn the market in whichever direction he likes. However, he does not do this. Instead, he slowly accumulates positions over time (sideways movement) so as not to dramatically affect the price.
The composite man accumulates slowly for a few key reasons:
– To avoid tipping his hand too soon and spiking demand and the price prematurely before he has built a full position.
– To accumulate at better average prices over time. If he bought aggressively all at once, he would drive up the price drastically.
– To avoid spooking other market participants. If the composite man bought aggressively, other traders may think the price action is unsustainable and sell into the spike.
– To absorb as much selling interest over time as possible. By accumulating slowly, the composite man allows sellers to exhaust themselves over an extended period.
The composite man is patient and strategic. He is willing to accumulate slowly over a period of ranging, sideways price action. He does this to methodically build a substantial position without prematurely alerting the rest of the market through dramatic price spikes. Once the composite man has accumulated enough supply and the selling pressure subsides, he can then mark the price up and benefit from the uptrend. But he avoids tipping his hand too soon by patiently and slowly accumulating beforehand.
Accumulation (with composite man in mind)
Uptrend
The Composite Man begins pushing the market upward when he holds enough shares and the selling force is exhausted. Naturally, the growing trend draws more investors, which raises demand.
Notably, accumulation can occur in various stages throughout an uptrend. When the larger trend pauses and consolidates for a while before continuing to rise, these periods may be referred to as re-accumulation phases.
Other investors are encouraged to buy as the market rises. Even the general public eventually gets fired up enough to participate. Right now, supply is inadequately outpacing demand.
Distribution
The composite man begins offloading his assets at a profit, usually as euphoria enters into the traders that are late. This gives another sideways move that absorbs demand.
Downtrend
Soon after the distribution phase, a downtrend occurs due to the fact that the composite man is selling his positions. It’s common that we see a dead cat bounce here where price attempts to break the previous high, sometimes trapping bulls. This just gives the composite man more opportunity to sell at higher prices.
Some Ways To Trade Wyckoff Method
Phase B – Trading the Spring
– Entry: After a spring formation (bear trap), enter a long position once the price trades back above the broken support level. Place a stop loss just below the spring low.
– Targets: Take partial profits at the resistance levels of the previous trading range. Trail stops to lock in gains as the price continues higher. Target back to the top of the previous range or higher.
– Rationale: The spring shakes out weak longs, allowing for a test of the lows. Strong buying interest at the lows suggests the downtrend is over. The spring sets up a low-risk, long entry with a defined stop.
Phase C – Trading the Upthrust
– Entry: After an upthrust formation (bull trap), enter a short position once the price trades back below the broken resistance level. Place a stop loss just above the upthrust high.
– Targets: Take partial profits at the support levels of the previous trading range. Trail stops lower to lock in gains as the price continues lower. Target back to the bottom of the previous range or lower.
– Rationale: The upthrust tricks eager bulls, allowing for a test of the highs. Strong selling interest at the highs indicates the uptrend is over. The upthrust sets up a low-risk short entry with a defined stop.
Phase E – Trading the Breakout
– Entry: Enter a long position as the price breaks out of an accumulation range after a spring/uptrest test of the lows. Use volume for confirmation of the breakout.
– Targets: Take partial profits using 1.5-2x the height of the accumulation range projected from the breakout price. Trail stops to lock in gains.
– Rationale: The successful retest of the lows confirms demand. Increased volume on the breakout signals the composite man is ready to mark the price up. Target based on the principle of measured moves.


