

Introduction
Candlesticks are by far the most used chart type in trading and investing today. Heikin Ashi candles take this one step further and smooth out the price action to create a less volatile chart for traders to analyze.
In this guide, we will look at the Heikin Ashi candles, what indicators work well with them, and how we can implement these candlesticks into our trading plan in an effective way.
What is Heikin Ashi Candles Chart?
heikin ashi candles explained and the origin
Heikin Ashi, which translates to “average bar” in Japanese, is a type of candlestick charting technique that provides a smoothed-out version of price action. Developed in the 1700s by Munehisa Homma, a rice merchant from Sakata, Japan, Heikin Ashi candles have stood the test of time and have found their place in the modern world of trading.
Unlike traditional candlesticks, which plot the actual open, high, low, and close prices for each period, Heikin Ashi candles use a modified formula that takes into account the average price over two periods. This averaging method is what gives Heikin Ashi charts their signature smooth appearance.
Heikin Ashi Calculation
The construction of Heikin Ashi candles involves a specific formula that calculates the open, high, low, and close prices differently from traditional candlesticks. For anyone looking how are heikin ashi candles calculated, here’s the heikin ashi candle formula:
- Close = (Open + High + Low + Close) / 4
- The close price of a Heikin Ashi candle is the average of the open, high, low, and close of the current period.
- Open = (Previous Heikin Ashi Open + Previous Heikin Ashi Close) / 2
- The open price is the average of the previous Heikin Ashi candle’s open and close prices.
- High = Maximum of the High, Heikin Ashi Open, or Heikin Ashi Close
- The high price is the highest value among the period’s high, the Heikin Ashi open, and the Heikin Ashi close.
- Low = Minimum of the Low, Heikin Ashi Open, or Heikin Ashi Close
- The low price is the lowest value among the period’s low, the Heikin Ashi open, and the Heikin Ashi close.
Because each candle uses data from the one before it, Heikin Ashi charts filter out some of the noise you’d see with standard candlesticks. This makes it easier to spot trends and reversals with fewer false signals.
Heikin Ashi Candle Types
Just like traditional candlesticks, Heikin Ashi candles come in two main types:
Bullish Heikin Ashi Candle
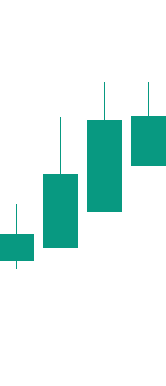
- Green body
- Occurs when the close is higher than the open
- Shows buying pressure just like normal candles
Bearish Heikin Ashi Candle

- Red body
- Occurs when the close is lower than the open
- Shows selling pressure just like normal candles
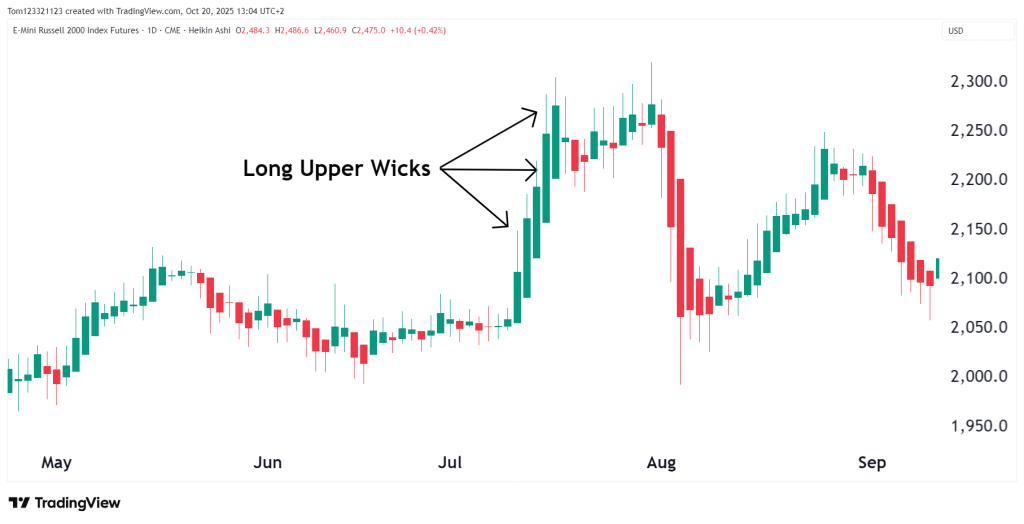
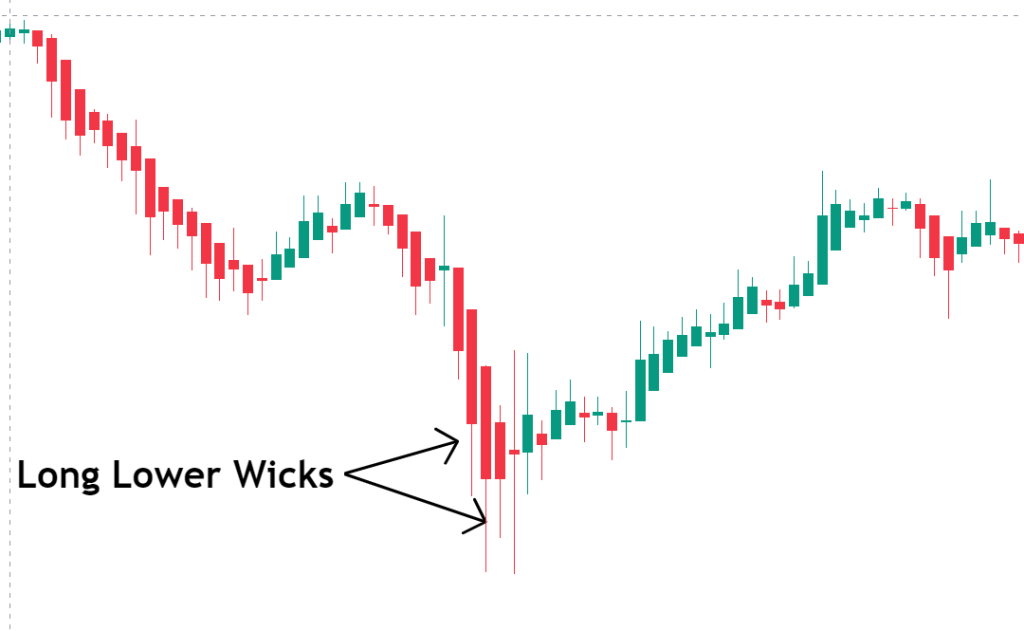
Besides the color of the candle body, the length of the wicks on a Heikin Ashi candle gives important clues about market behavior during that time.
Long upper wicks can indicate strong buying pressure, while long lower wicks can indicate heavy selling. If a candle has little to no wick on one side, it may show a strong directional move — for example, a candle with no lower wick often points to a strong uptrend with little pullback.
Traders pay attention to wick length because it shows how far price moved during the period and how much of that move held. This helps gauge momentum, potential reversals, or indecision in the market. In short, the wicks offer extra insight into the strength and reliability of a trend beyond what the candle’s color alone can indicate. This is important for almost every heikin ashi candle strategy.
How To Get Heikin Ashi Trading Chart
In todays world, most trading platforms and software will have free heikin ashi charts to use. At the OneUp Trader funded trader program, we provide a free Ninjatrader license key to all users where heikin ashi candlesticks are ready to be used.
Here are some of the advantages you will find with OneUp Trader, if you are interested in signing up for an evaluation or would like to try a 7-day free trial, use the button below.
1. Only 1 step to Funding, with fair and attainable targets.
2. No Data Fees for Funded traders – that’s savings of over $444 per month!
3. FREE Unlimited Profit withdrawals when you get funded! Requests are processed the same day!!
4. 24/7 Real-time Customer Support desk!
5. Our Funding partners have a 2 strike policy for violations!
6. Eligible traders can fast-track the evaluation and receive funding after 5 trading days!
7. Our groundbreaking Trailing Drawdown stops trailing once it reaches the initial starting balance.
8. No Daily Loss limit!
9. Access to our community of traders via our Discord Server.
10. Access to quality educational webinars and videos to enhance your trading potential.
11. We offer Account Sizes up to $250,000.
12. No restrictions on how you trade when funded and many more!
We’ve successfully appointed thousands of traders with our Funding Partners since inception and we’re continuously expanding our reach. We believe that OneUp Trader delivers more value than it costs and hope you’ll agree that we’re simply incomparable.
Heikin Ashi vs. Traditional Candlesticks
Key Differences
When it comes to heikin ashi vs candles, both show a visual of price action, but there are some important differences between them:
Calculation Method
- Traditional candlesticks plot the actual open, high, low, and close prices for each period.
- Heikin Ashi candles use a modified formula that averages price data over two periods. (Can be more useful for momentum traders and trend following strategies)
Visual Appearance
- Traditional candlestick charts often appear more jagged and volatile. (Can be more useful for scalpers)
- Heikin Ashi charts have a smoother, more linear appearance due to the averaging of price data.
Relationship between Open and Close
- In traditional candlesticks, the open and close prices are the actual prices at which the period started and ended.
- In Heikin Ashi candles, the open and close prices are calculated using the modified formula and may not match the actual open and close prices.
Advantages of Heikin Ashi Candles
candles vs heikin ashi
Heikin Ashi candles have some unique features that give them an edge over traditional candlesticks, especially when it comes to spotting trends and filtering out market noise. Here’s how:
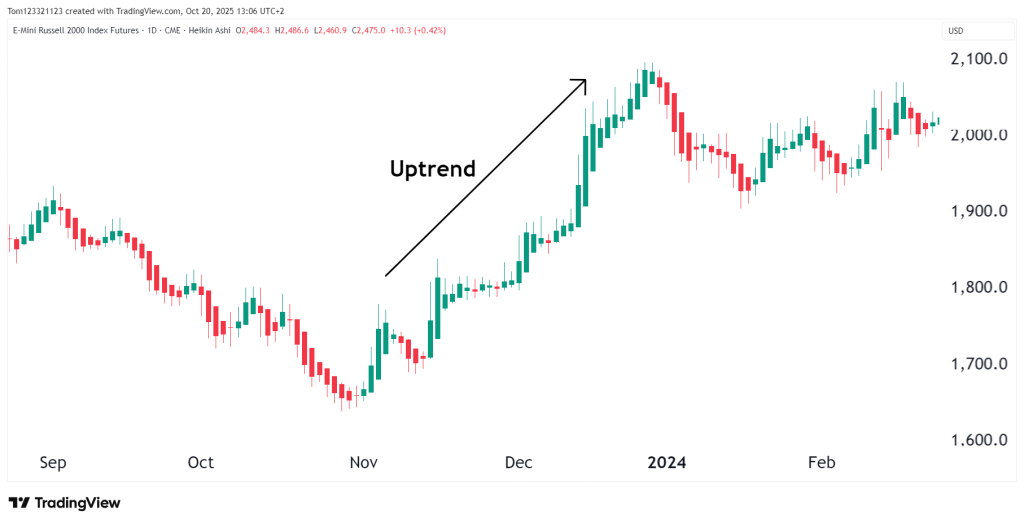
1. Clearer Trend Direction
Heikin Ashi candles smooth out price data, which makes it much easier to see the overall trend.
- In an uptrend, candles usually have green bodies and little to no lower wick, showing steady upward movement.
- In a downtrend, candles often have red bodies with no upper wick, showing consistent downward pressure.
This visual clarity helps traders stay in trades longer by filtering out minor pullbacks that can often trigger early exits when using regular candlesticks.
2. Reduced Market Noise
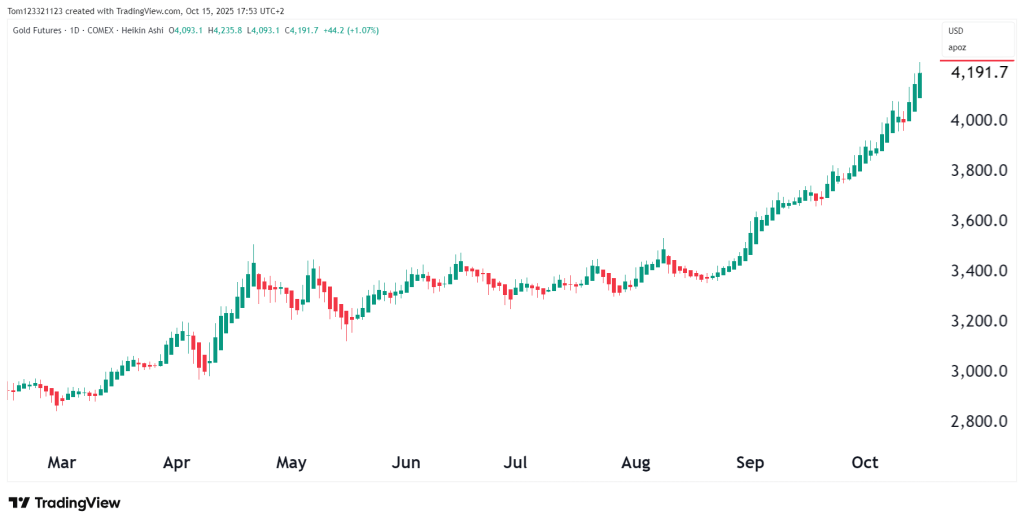
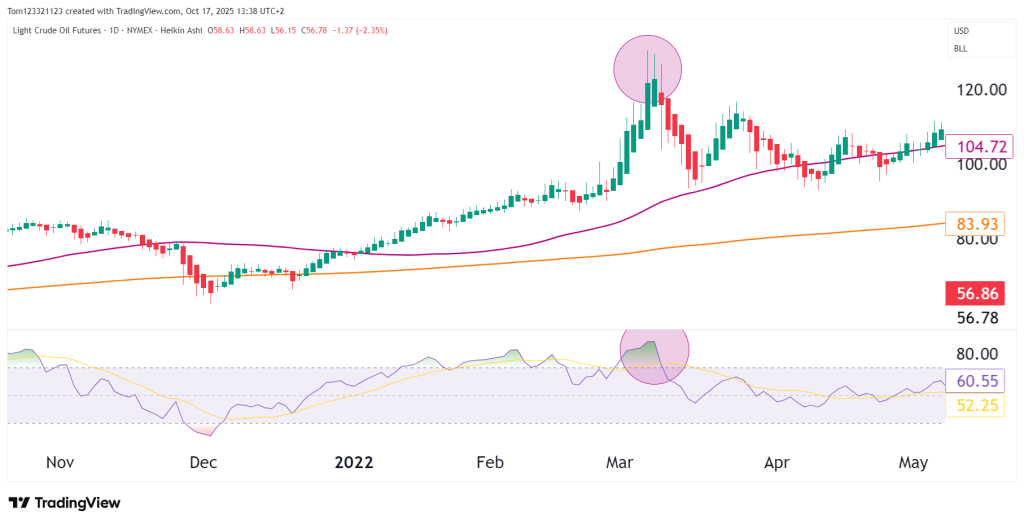
Because Heikin Ashi averages data from the current and previous periods, it removes a lot of short-term price swings and random movements. Below is a comparison between a heikin ashi chart, and a regular chart over the same period.
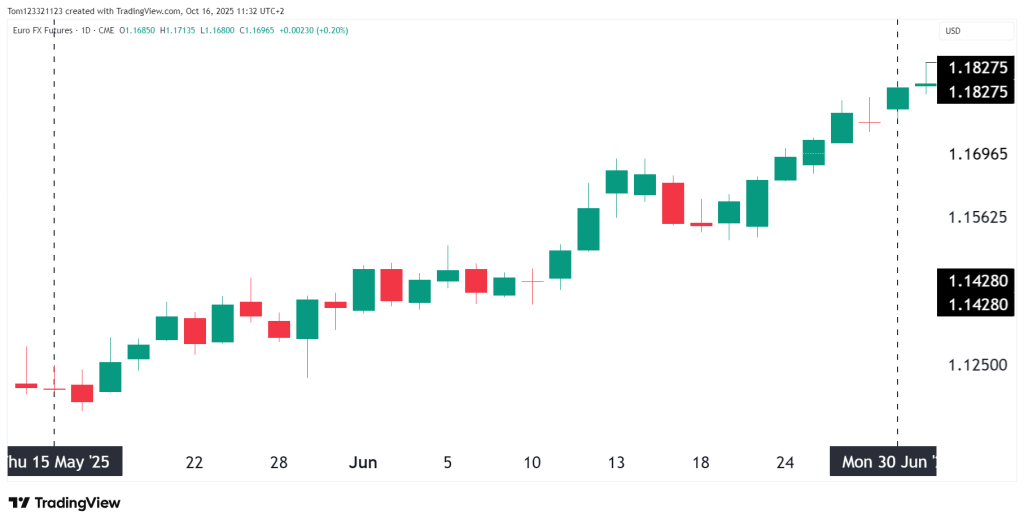
Notice how there are far fewer red candles in the uptrend on the heikin ashi candlestick chart vs the normal candlestick chart. This helps traders focus on the bigger picture rather than reacting to every small move, which can reduce emotional decision-making and limit the chances of being shaken out by false signals.
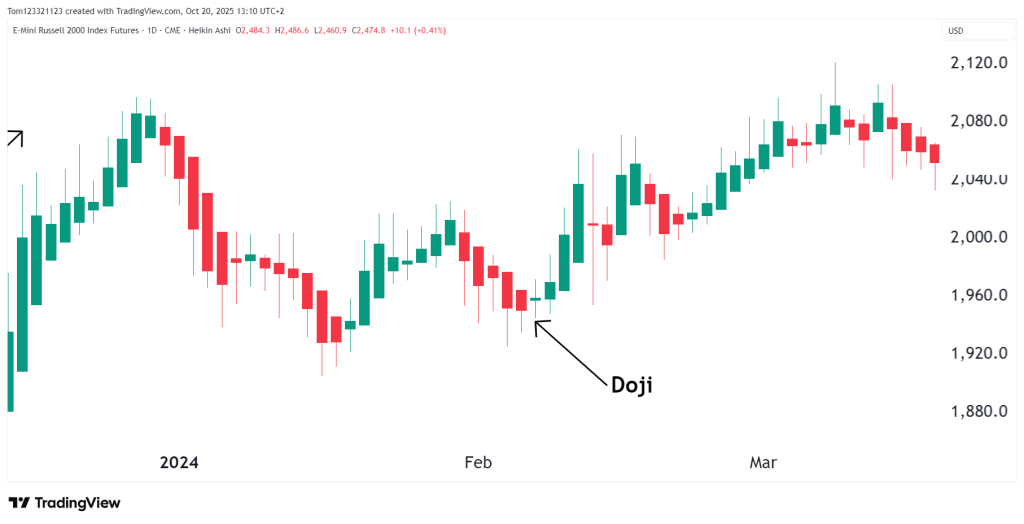
3. Easier Spotting of Reversals
Heikin Ashi candles also make it easier to notice when a trend might be running out of steam.
- A color shift — for example, from a series of green candles to a red one — can hint at a trend change.
- A doji-like candle (where the open and close are nearly the same) shows indecision and could be an early warning that the current trend is weakening.
By making trend shifts more obvious, Heikin Ashi helps traders react more confidently and avoid chasing moves that are already losing momentum.
How to Use Heikin Ashi Candles
Interpreting Candle Color and Shape
The color (something obvious to traders) and shape of Heikin Ashi candles reveal a lot about market mood and price momentum. While some of these patterns overlap with what we’ve already covered, it’s useful to understand how to read them at a glance:
- Green Candles show buyers are in control and pushing prices up — typical during uptrends.
- Red Candles reflect selling pressure and downward momentum — common in downtrends.
Even though we have already covered it, the importance of what the wicks reveal can’t go unsaid:
- No Lower Wick? That usually means strong upward momentum. Buyers kept control from the open to the high, with no real pullback.
- No Upper Wick? That points to strong selling — prices dropped from the open and never looked back.
And then there are doji candles, which have little or no body because the open and close are nearly the same. These often signal indecision and can be early signs of a trend reversal, especially if they show up after a strong uptrend or downtrend.
Together, the color and structure of each candle give traders quick, visual clues about who’s in control — buyers, sellers, or neither — and what might come next.
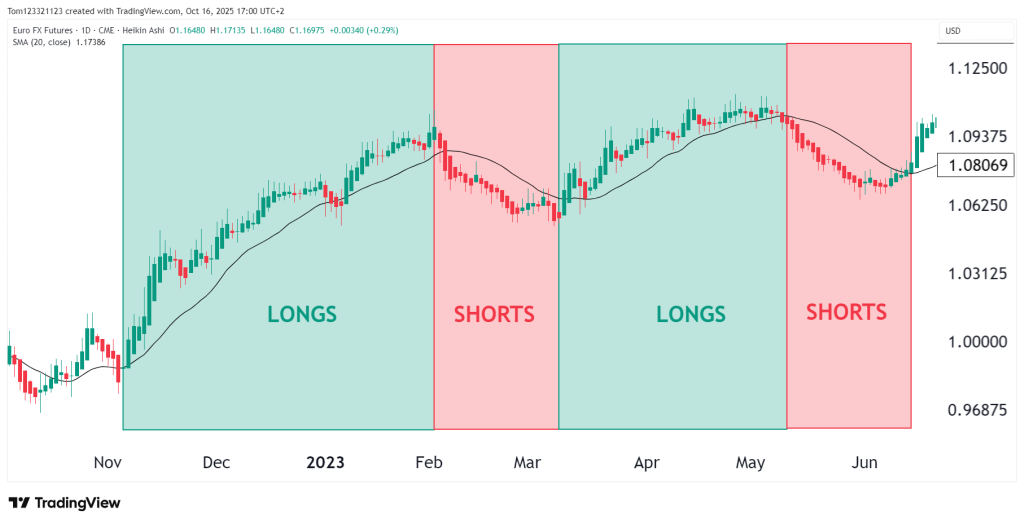
Identifying Trend Strength and Direction
As we have already covered, one of the main advantages of Heikin Ashi candles is how clearly they show trend strength and direction. They can also be paired with moving averages and other indicators. Moving averages provide even more filtering on the price, for example, applying a 20 day moving average and taking only longs once price is above it and shorts when price is below it.
Here are other simplified aspects of what to look for:
Strong Uptrend
You’ll see several green candles in a row, usually with little to no lower wick. This shows steady buying and strong bullish momentum. If wicks start to form on the bottom, it’s a sign of the buying power weakening.
Strong Downtrend
A series of red candles with barely any upper wick signals heavy selling and solid downward pressure. The same is if wicks start to form on the top, it’s a sign of the selling power weakening.
Weak or Sideways Trend
When candle colors alternate and both wicks are visible, it suggests indecision or range-bound movement; the market isn’t committing to a direction.
Watching how these candles form, their color, shape, and sequence, helps traders quickly understand what kind of trend they’re dealing with and adjust their strategy accordingly. It cuts through the noise like standard candlesticks can’t.
Trading Strategies with Heikin Ashi Candles
Trend Following Strategy
Using Heikin Ashi Candles for Trend Following
A common and effective heikin ashi strategy is to follow trends. This strategy focuses on identifying the current market direction and trading with that momentum. Remember, each system needs to be tested before it is used in the market. Take your time in testing strategies and find what works for you. Here’s a step-by-step guide:
1. Spot the Trend
Uptrend: Look for several green candles in a row, ideally with no lower wicks, and apply a moving average for extra filtering.
Downtrend: Look for several red candles in a row, usually with no upper wicks, and apply a moving average for extra filtering.
2. Enter the Trade
In an uptrend, consider entering a long position when a new green candle appears.
In a downtrend, consider entering a short position when a new red candle forms.
3. Set a Stop Loss
For long trades, place your stop loss just below the low of the most recent candle.
For short trades, place it just above the high of the most recent candle.
4. Set a Profit Target
Use tools like support and resistance levels, previous swing highs/lows, or Fibonacci extensions to find realistic price targets.
Alternatively, you can use a trailing stop loss to lock in profits as the trend continues. This lets you stay in the trade longer while protecting gains.
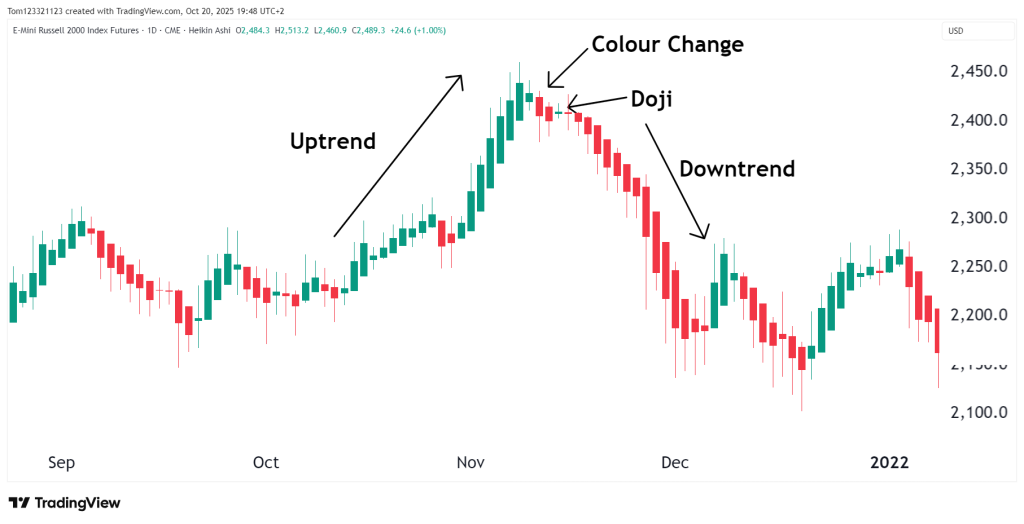
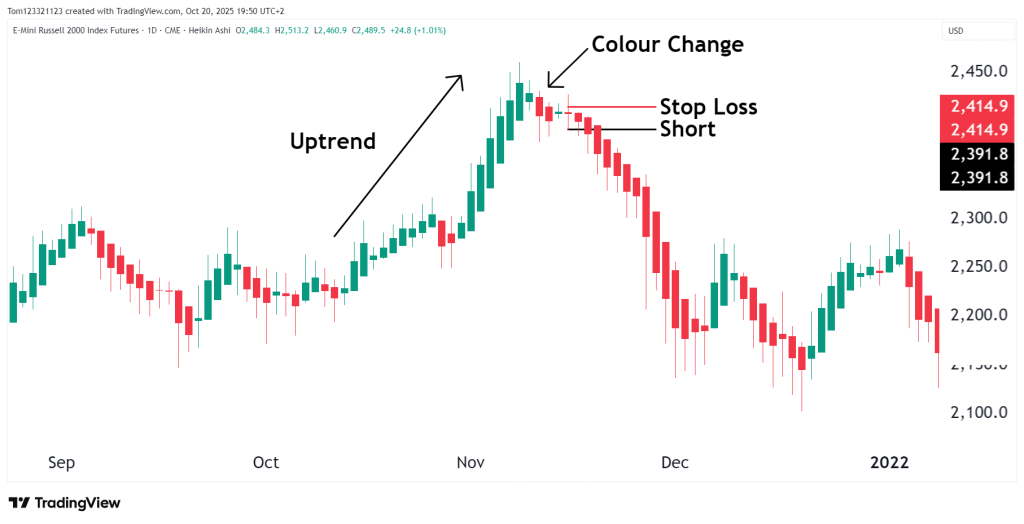
5. Know When to Exit
Find a well-tested risk management system and one you are comfortable with. There is no exact formula here because every trader is different.
Watch for signs like a candle color change, a doji candle, or smaller candles with long wicks; these can signal a possible reversal.
Heikin Ashi Trading Strategy
Reversal Trading Strategy
While Heikin Ashi candles are excellent for identifying and following trends, they can also be used to spot potential trend reversals. Here’s a reversal trading strategy using Heikin Ashi:
Identify a Strong Trend:
- Look for a series of consecutive green candles in an uptrend
- Look for a series of consecutive red candles in a downtrend
Watch for Reversal Signals:
- Look for a change in candle color, such as a red candle following a series of green candles or vice versa
- Watch for the appearance of a doji candle, which can indicate indecision and a potential reversal
Confirm the Reversal:
- Wait for the next candle to close in the direction of the potential reversal
- Look for additional confirmation from other technical indicators, such as a breakout of a key support or resistance level
Enter the Trade:
- For a bearish reversal, enter a short position when the confirmation candle closes
- For a bullish reversal, enter a long position when the confirmation candle closes
Set Stop Loss:
- Place your stop loss above the high of the reversal candle in a bearish reversal
- Place your stop loss below the low of the reversal candle in a bullish reversal
Determine Profit Target:
- Use technical analysis techniques, such as support and resistance levels or Fibonacci retracements, to set your profit target, or look for a doji candle.
- Consider using a risk-to-reward ratio to ensure a favorable trade setup.
This is just one example of how a reversal trade can work using heikin ashi candles, but as always, all strategies must be back tested.
Combining Heikin Ashi with Other Technical Tools
While Heikin Ashi candles are very useful on their own, they become even more powerful when used alongside other technical analysis tools. Combining methods helps traders build a more complete view of the market and make better-informed decisions.
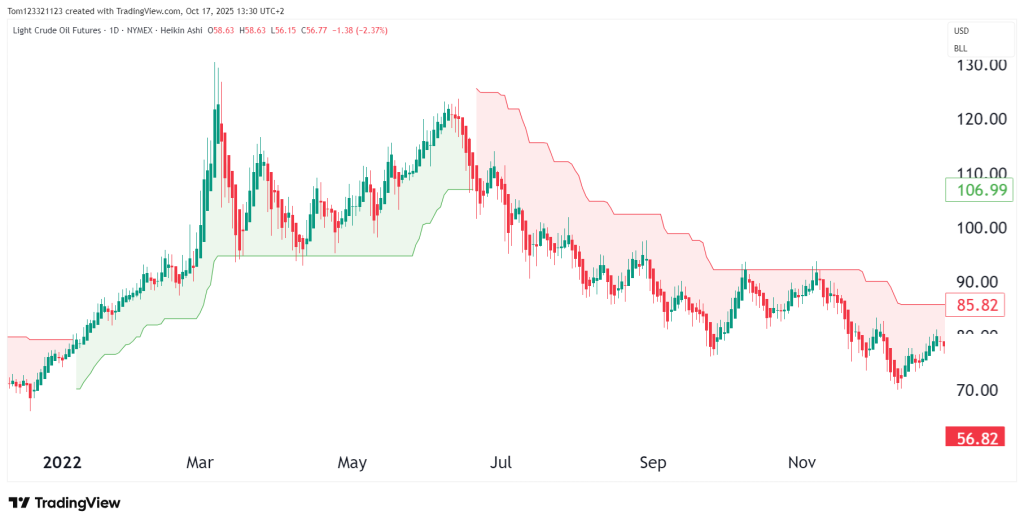
In the example below, applying the Supertrend indicator on top of the Heikin Ashi can filter the trends even further.
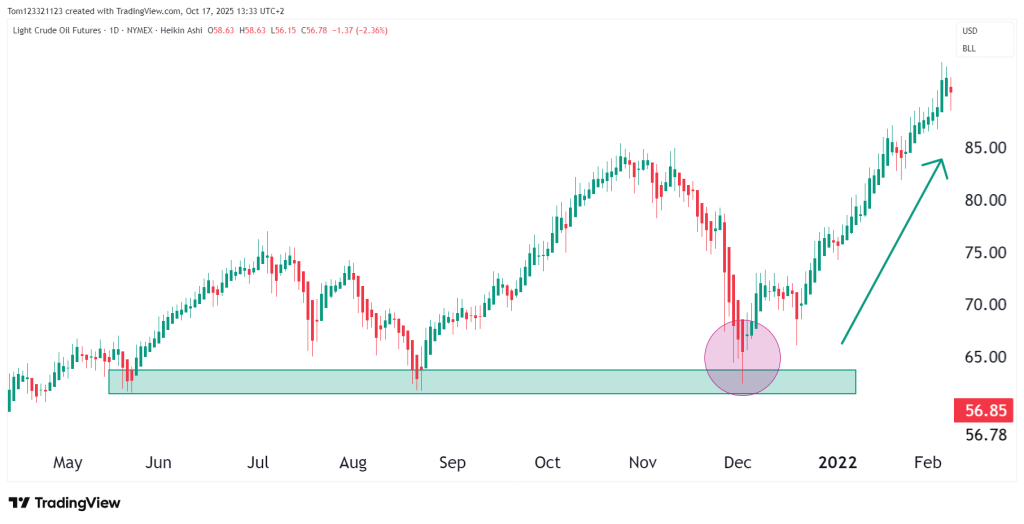
One effective way to use Heikin Ashi is in combination with support and resistance levels. The candles can help identify the strength and direction of a trend, while support and resistance zones offer key reference points for possible breakouts or profit targets. When a Heikin Ashi trend lines up with a break above resistance or a bounce from support, the signal gains more weight.
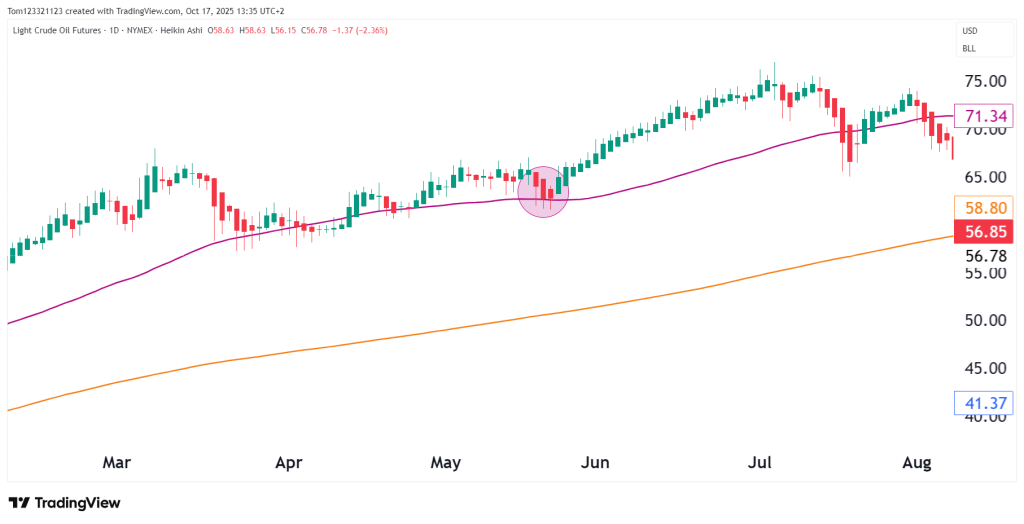
Moving averages are another great tool to pair with Heikin Ashi. A 50-period or 200-period moving average can give you a sense of the overall trend direction. If Heikin Ashi candles are showing consistent green above the moving average, it supports the case for a strong uptrend. Similarly, red candles below a moving average reinforce the bearish trend. You can also watch for reversals when the candles start to change color near the moving average.
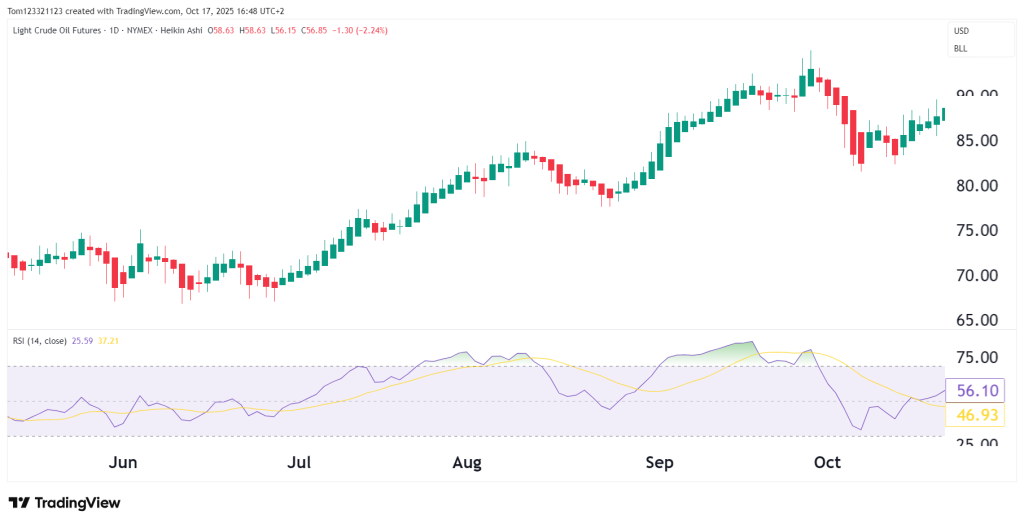
Momentum indicators like RSI or Stochastic can help confirm what you see in the candles. When these oscillators reach overbought or oversold levels, they suggest a possible turning point. If a shift in Heikin Ashi candle color happens at the same time, it adds confirmation that a reversal could be underway.
Traders can create a more well-rounded and reliable strategy by using Heikin Ashi candles with these tools and indicators. This combination gives greater confidence in entries, exits, and overall market direction, helping to reduce noise and improve consistency.
Limitations of Heikin Ashi Candles
While Heikin Ashi candles offer many advantages, it’s important to understand their limitations to use them effectively. One of the key drawbacks is their lagging nature. Because Heikin Ashi uses averaged price data from two periods, the candles often react more slowly to changes in the market. This can lead to delayed entry or exit signals, causing traders to miss opportunities, especially in fast-moving conditions.
Another limitation is the loss of price detail. The same smoothing effect that makes trends easier to spot can also hide important short-term movements or key price levels. This can be a drawback for traders who rely on precise data for scalping or very short-term strategies.
Heikin Ashi also performs best in trending markets, when the price is moving clearly up or down. In sideways or choppy conditions, the candles become less reliable. They may show false signals, such as breakout patterns that don’t follow through, which can lead to whipsaws and frustration.
It’s also important to remember that Heikin Ashi candles don’t show actual market prices. Their open and close values are calculated differently, so they don’t reflect the exact price at which a trader could buy or sell. Misreading these as real-time prices can lead to mistakes in execution.
Conclusion
Heikin Ashi candles provide a useful perspective on market trends by filtering out noise and making direction clearer. They can help traders stay in trends longer and avoid reacting to minor price swings. But they aren’t perfect and shouldn’t be used in isolation.
For best results, Heikin Ashi should be used alongside other tools, such as traditional candlesticks, support and resistance levels, or indicators, and backed by solid risk management. Their smoothing effect is powerful, but knowing when to trust it (and when not to) is key.
Success with Heikin Ashi, like any trading method, comes from practice, patience, and constant learning. Whether you’re new to trading or refining your strategy, Heikin Ashi candles can be a valuable addition to your approach. Just remember: no single tool guarantees success. A disciplined mindset, a well-rounded plan, and ongoing improvement are what truly make the difference.
With the right strategy and consistent effort, Heikin Ashi can help you trade more confidently and see the market with greater clarity.
The information and analysis provided herein are for educational and informational purposes only, and are not trade or investment recommendations. Futures trading involves substantial risk and is not suitable for all investors. You may lose all of your invested capital and more. Always do your own due diligence and consult with a qualified financial professional before making trading decisions.