


Average True Range Indicator Explained
The average true range (ATR) is a technical analysis indicator that measures market volatility and helps determine trend strength. Also referred to as the ‘atr indicator’ or ‘atr average true range,’ it calculates the average range between high and low prices over a specified timeframe. The average true range indicator, or ATR, shows traders the degree of interest or disinterest in a market at a given point in time. By understanding the average true range formula and how to use the average true range indicator, traders can gain an edge over the market.
What is Average True Range Indicator?
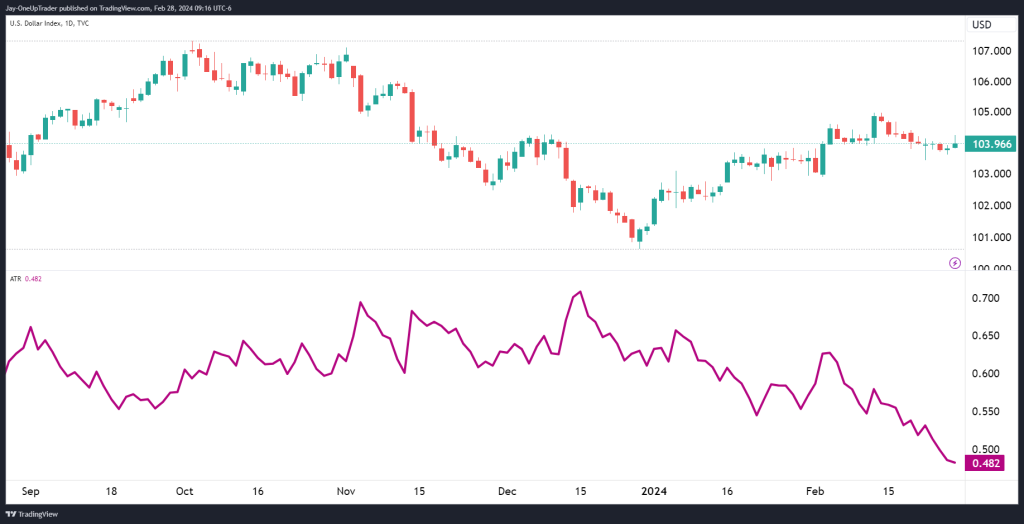
The ATR value reflects the degree of volatility in the market. A higher ATR reading equals higher volatility, and a lower ATR reading equals lower volatility. When markets are trending strongly, ATR values tend to be higher. During rangebound or quiet market conditions, ATR values are generally lower. By analyzing average true range values over time, traders can gauge periods of expansion or contraction in volatility.
Average True Range Definition
The average true range definition refers to the indicator’s role in measuring the degree of price volatility in a given market. The ATR encapsulates volatility into a single value based on the average trading range over a set period. It aims to smooth out fluctuations to provide an objective view of how much prices are varying on average. The ATR reading allows traders to gauge periods of expansion or contraction.
How is the ATR indicator Calculated?
This is the average true range:
- Calculate the True Range (TR): TR = High – Low
- Apply exponential moving average (EMA) to the TR values for the defined number of periods. This gives the average true range.
- The default setting is a 14-period ATR, but traders can adjust this.
All charting software does this calculation automatically for you, but it is good to know how it is calculated to have a better understanding of the indicator.
How to use the ATR Indicator
The ATR indicator helps traders in three main ways:
- Identify volatility – The absolute ATR value reflects the degree of volatility. Higher ATR = higher volatility and vice versa.
- Trade entry and exit signals – Traders can use ATR to determine stop losses. A common approach is to set stops 2-3x the ATR value below a long entry or above a short entry.
- Position size calculation – The ATR value can help determine appropriate position size based on one’s risk tolerance. Larger ATR warrants smaller positions.
In general, ATR values are higher when markets are trending strongly and lower during range bound or quiet markets. Traders look for ATR breakouts to signal potential trading opportunities. The ATR indicator works on any time frame – daily, hourly or lower. It can be used across forex, stocks, indices and commodities.
Average True Range Strategies & Benefits
The ATR indicator can be used in several ways to enhance trading strategies and risk management. Here are some key uses and how to use average true range effectively:
Stop Losses
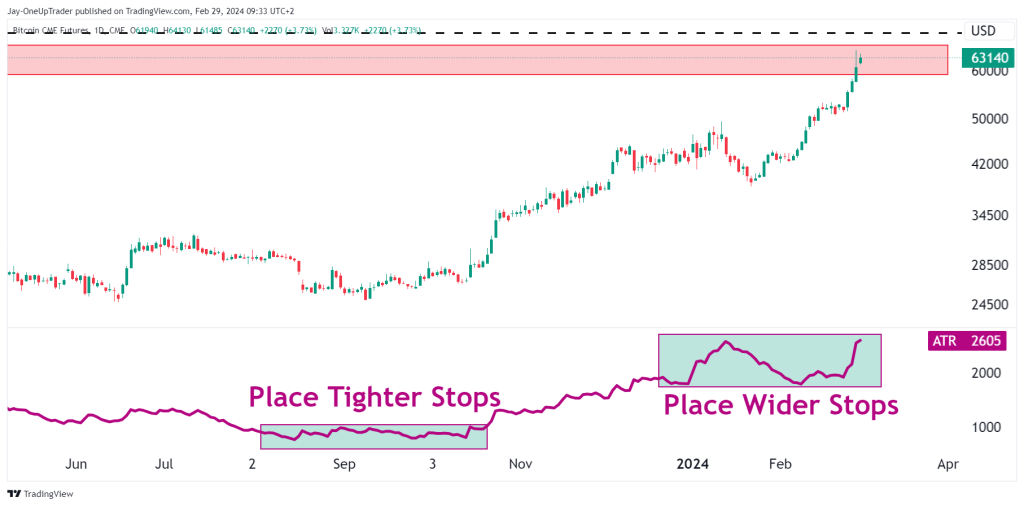
Where the stop is placed depends on the trading style. Aggressive traders may use stops at 2x ATR, while conservative traders may use 3-4x ATR. Stops can be placed below support levels on long trades, or above resistance for short trades. If the ATR reading is high, wider stops should be used. Lower ATR allows tighter stop placement.
The key point is that ATR provides an objective measure for setting stops based on current volatility conditions. Traders can experiment to find their optimal stop loss distance based on ATR. As volatility changes over time, ATR will capture this so stops can be continually adjusted. Properly setting stops is vital for risk management. The ATR indicator helps take the guesswork out of effective stop placement in changing market conditions.
Gauge Volatility
Higher ATR readings signal greater volatility and more price fluctuation. Lower ATR represents diminished volatility and tighter ranges.
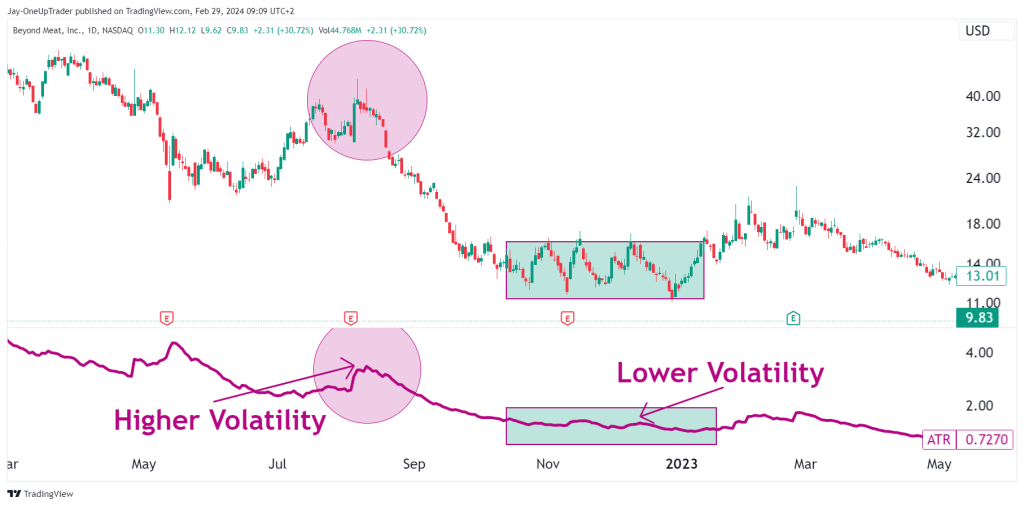
Comparing the ATR value over time reveals how volatility conditions are changing. For example, if the 14-day ATR rises from 30 pips to 60 pips, it signals volatility is expanding in that market. Traders can compare the current ATR to past ranges to see if volatility is high or low based on historical standards. Markets with ATR values above their historic norms are showing heightened volatility.
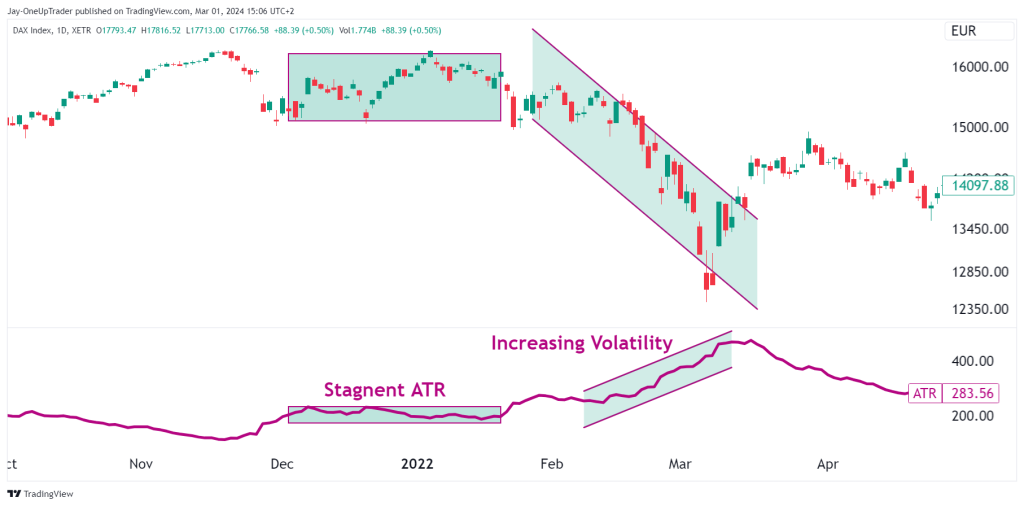
Monitoring the ATR line also reveals how volatility is progressing. An upward-sloping ATR line shows increasing volatility. If the ATR line is stagnant, it tells traders that volatility conditions are steady. A declining ATR line signals volatility contraction.
The ATR’s insight into changing volatility is valuable for timing trade entries and exits. Entering when volatility is dropping helps get better prices. Exiting before volatility expands protects against adverse moves. Check ATR first before entering any new trade position to ensure volatility aligns with your goals.
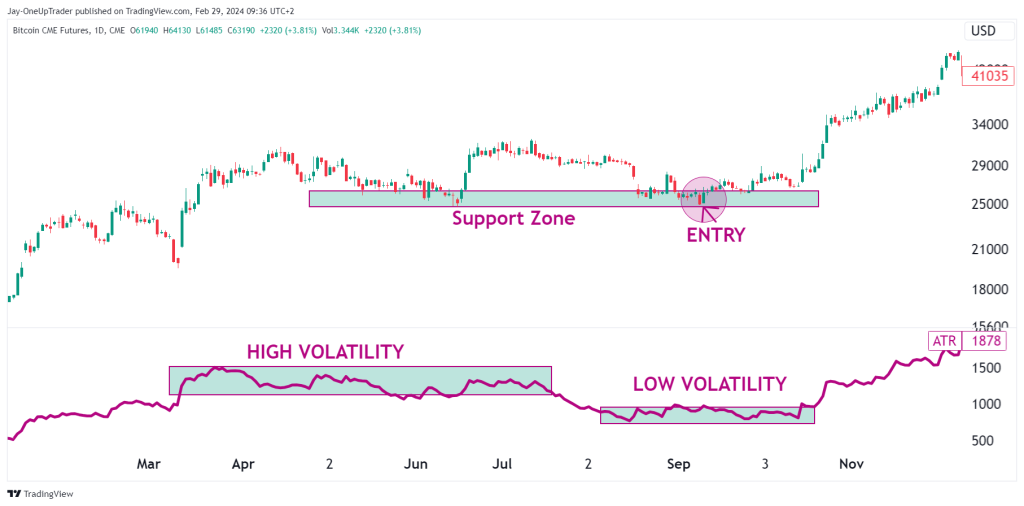
In the chart below, there is a support zone that formed during a period of high volatility. The ATR begins to dip while price remains sideways. Price moves into the support zone, and the ATR is low, and once we get a bullish candlestick pattern, there is an entry possible. Taking the entry when the volatility is low increases the probability of the trade being a winner because the entry is taken before the ‘big move’ when the volatility increases. Basically, if we are swing trading or position trading, we want to take positions when the volatility is low, and exit when it is high.
Size Positions
Size Positions – The ATR reading can guide traders on appropriate position sizing based on one’s risk tolerance. When the ATR value is high, it signals wider price swings and greater volatility. This increases the risk per trade, so smaller position sizes are warranted.
Conversely, lower ATR values suggest tighter trading ranges and less volatility. This allows taking on larger position sizes if one chooses, as the risk is reduced. As a rule, traders should reduce position sizes as ATR rises, and increase sizes as ATR falls.
For example, a trader may start with a baseline position size of 0.1 lots. When the 14-day ATR is 50, the size could remain at 0.1 lots. But if ATR rose to 100, indicating high volatility, the position size should be reduced – perhaps cut in half to 0.05 lots. This keeps risk controlled as volatility expands.
Traders can establish ATR-based rules for adjusting position size. For instance, cut the size in half when ATR rises by 50%, and double the size when ATR drops by 50%. The ATR provides an objective measure for dynamically sizing positions based on changing volatility conditions.
Conclusion
When utilizing the ATR indicator in your trading, it’s important to remain disciplined and consistent with your strategy. The ATR provides objective data, but traders must stick to their plan without overreacting. Have rules set ahead of time for adjusting stops, sizes and entries based on ATR. Don’t override the system based on emotions. Be patient with trades during low ATR regimes, and proactive when volatility picks up. The ATR gives probabilities, but traders must still filter signals against other indicators and manage risk. Follow the ATR guidance, but don’t assume it’s foolproof. By blending ATR analysis with disciplined psychology, traders can make lasting use of this valuable volatility tool.
The ATR indicator offers great benefits if used prudently. But human judgement is still essential to apply its wisdom effectively. Mastering both the indicator and your own behavior is key to trading success.


