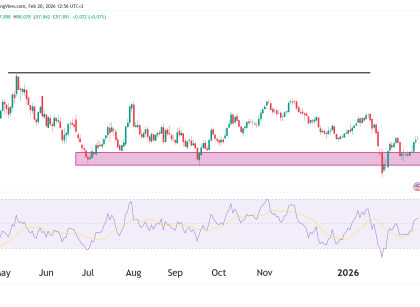
Gold futures GC daily chart
Technical Analysis

Gold Futures (GC) – Is the Rally Getting a Second Wind?

Price Snapshot (as of May 6, 2025): Technical Analysis Trend Moving Averages RSI Momentum Key Price Levels Type Level Notes Support $3,110 50-day MA & breakout pivot Support $3,000 Psychological round level Resistance None Blue sky breakout Extension $3,500–3,650 Measured move from breakout flag Why Is Gold So Strong? Drivers Behind Gold’s Outperformance Bear Case? Read More…

crude oil technical analysis
Technical Analysis

Crude Oil Futures (CL) – Bearish Price Action

Overview: Weekly Chart Technicals: Structure Breakdown RSI Analysis Daily Chart Technicals: Downtrend Intact RSI Key Levels: Type Level Note Resistance $65.00–66.00 Breakdown retest zone (failed) Resistance $70.00 200-day MA + descending trendline Support $55.16 Horizontal support, 2024 low Support $51.46 Measured move + next pivot (S1) Probability Outlook Scenario Probability Trigger Break below $55 → Read More…

S&P 500 futures
Technical Analysis

S&P 500 Futures (ES) – Breaking Out with a Bullish Bias?

Technical Summary Chart Analysis Pattern Development Outlook Scenario Probability Technical Trigger Continued breakout to 6,170+ 60% Clear path if 5,780–5,800 is reclaimed and held Range-bound pullback first 25% Retest of broken resistance ~5,465 zone before resumption False breakout and failure 15% Breakdown back below 5,465–5,400 with volume Bull Case: Bear Case: Final Take This breakout Read More…

Technical Analysis

U.S. Dollar Reversal? or Pause in the Pain?

Overview Technical Analysis Price Structure: Macro & Fundamental Drivers Key Economic & Geopolitical Factors Affecting the Dollar Recession Signals Mounting: Federal Reserve Policy Outlook: U.S. Fiscal Policy Risks: Global Central Banks: Risk Sentiment Shift: Comparative Currency View (Short-Term Bias) Currency Current Bias vs USD Rationale EUR Bullish ECB staying firm, EURUSD breakout underway JPY Mixed Read More…

dow jones technical analysis
Technical Analysis

Dow Jones Futures (YM) Technicals Mixed

Recap Current Status:Price has stabilized above $40,000, staging a grind higher — yet no breakout has occurred. Price Overview – April 29, 2025 Technical Picture Price Action: Pivot Levels: Support & Resistance Level Role S2 38,948 Confirmed support S1 40,604 Local resistance → now testing Pivot 42,362 Key inflection zone R1 44,018 First bullish breakout Read More…