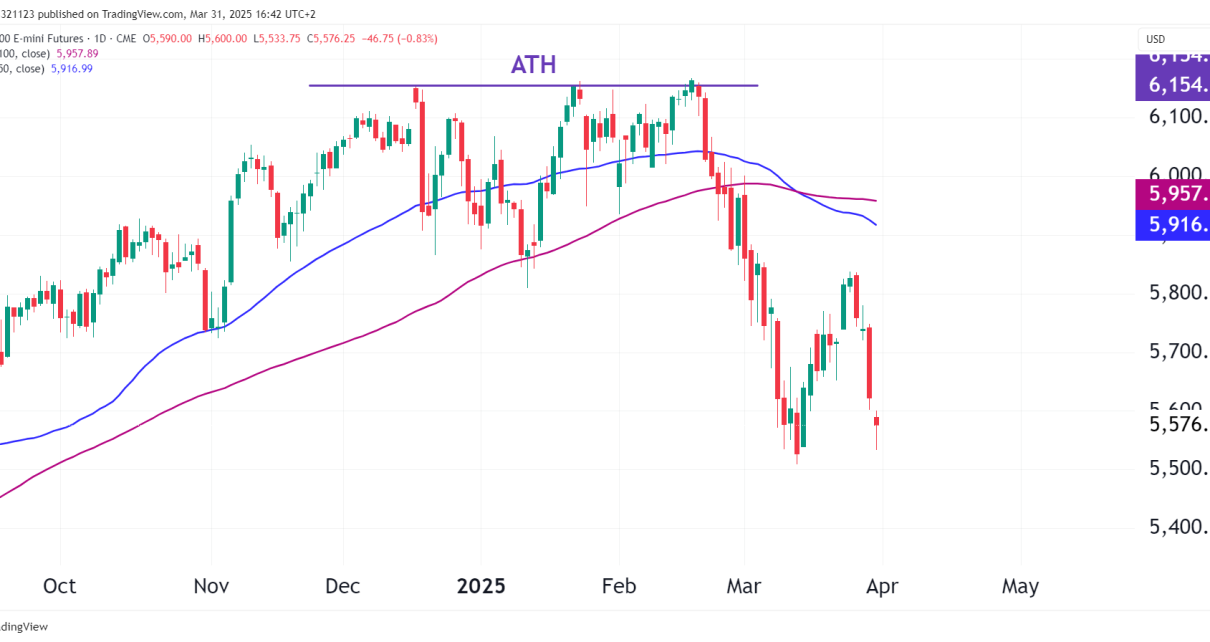
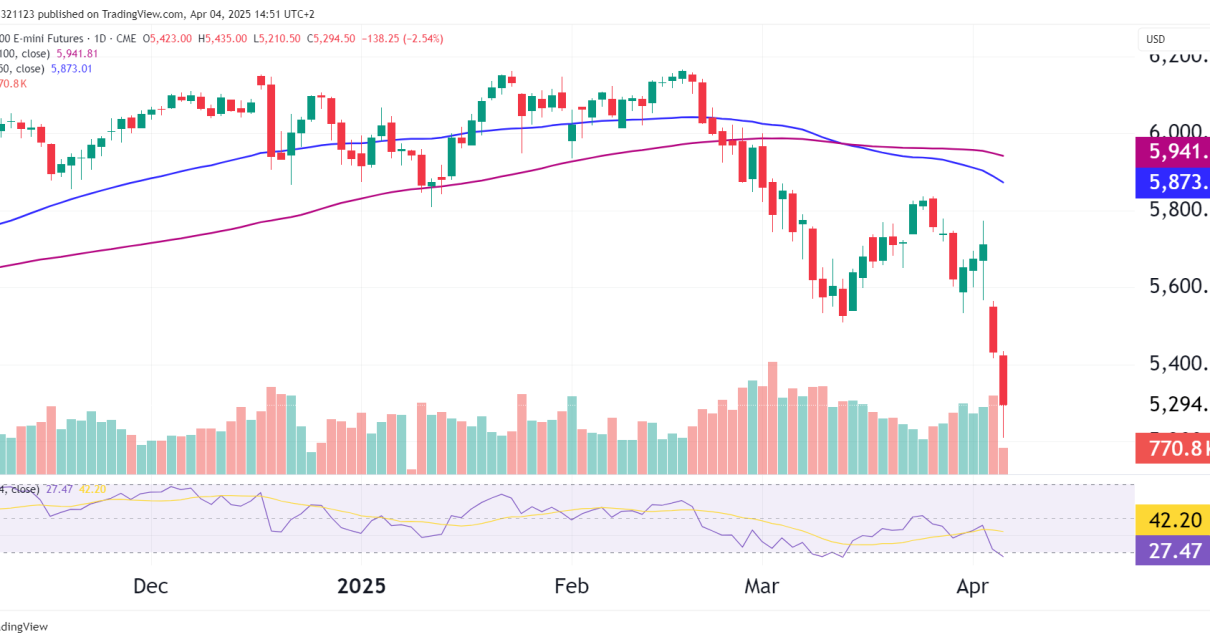
Introduction The S&P 500 has broken above all-time highs today on expectations that the first rate cut in four years is coming on the 18th of September. Traders are anticipating the first rate cut since March 2020, which comes after a prolonged period of high interest rates aimed at ‘combating inflation’. The expectations are that Read More…
Technical Analysis
E-mini Dow Jones (YM) Futures Technical Analysis
Ascending Channel and Key Support: Resistance Zone and Potential Breakout: Volume Analysis: Probabilities: Bullish Breakout Scenario: False Breakout and Reversal: Trade Opportunities
Will Russell 2000 (RTY) Continue to Lag NQ & ES?
Introduction:The Russell 2000 Index (RTY), which tracks small-cap U.S. stocks, has been underperforming relative to the broader equity indices like the Nasdaq 100 (NQ) and S&P 500 (ES), despite a modest year-to-date (YTD) gain of 5%. In comparison, the Nasdaq is up 14.3%, and the S&P 500 is up 16.8% YTD. This underperformance in small-cap Read More…
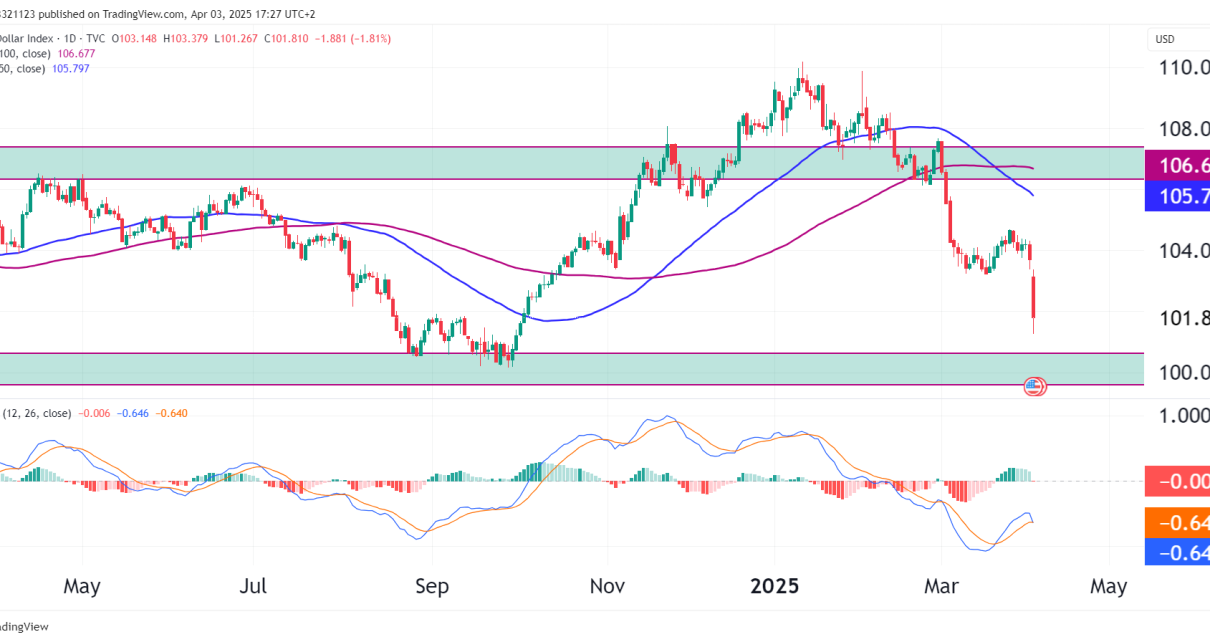
Does The Dollar (DXY) See Strength Returning?
Overview of the U.S. Dollar Index (DXY):The U.S. Dollar Index (DXY) is currently trading around 101.724, showing a recent bounce from a key support level. The DXY has been in a broad descending wedge pattern, which is generally considered a bullish continuation pattern. The bounce from 100.8 to 101.724 is significant, as it coincides with Read More…
Japanese Yen Futures (CME, Daily Chart) Technical Analysis
Overview and Market Sentiment:Japanese Yen futures have been in a strong upward move since June 2024, but there are signs of potential exhaustion, with the formation of a double top near the 0.0071010 level. The double top pattern, combined with bearish divergence and the volume profile, sets us up for a potential short opportunity with Read More…
NASDAQ (NQ) ‘Only In Correction’ Technical Outlook
Overview and Market Sentiment:The NASDAQ 100 futures (NQ) have been in a strong long-term uptrend, gaining 22% for one year, but the recent pullback is raising caution among traders. The daily chart shows a technical retracement after reaching an All-Time High (ATH) earlier in the summer, and now the price is testing key support levels. Read More…