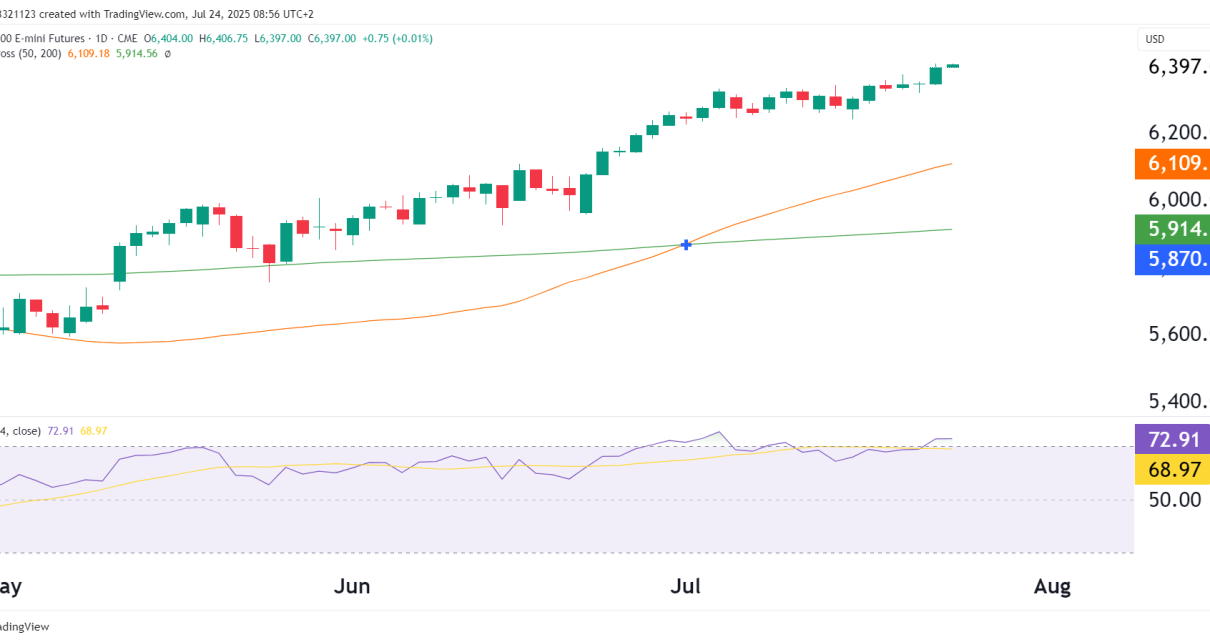
Overview Technical Analysis Price Structure: Macro & Fundamental Drivers Key Economic & Geopolitical Factors Affecting the Dollar Recession Signals Mounting: Federal Reserve Policy Outlook: U.S. Fiscal Policy Risks: Global Central Banks: Risk Sentiment Shift: Comparative Currency View (Short-Term Bias) Currency Current Bias vs USD Rationale EUR Bullish ECB staying firm, EURUSD breakout underway JPY Mixed Read More…
Technical Analysis
Crude Oil Futures (CL) – Under Sell Pressure
Recap from April 14 Outlook: In the last analysis, CL had just bounced from key support in the $57–$58 zone and was testing the underside of its former value area (~$66), attempting to confirm a higher low. We concluded that if CL couldn’t reclaim and hold above the 50-day SMA and resistance box, a return Read More…
Dow Jones Futures (YM) Technicals Mixed
Recap Current Status:Price has stabilized above $40,000, staging a grind higher — yet no breakout has occurred. Price Overview – April 29, 2025 Technical Picture Price Action: Pivot Levels: Support & Resistance Level Role S2 38,948 Confirmed support S1 40,604 Local resistance → now testing Pivot 42,362 Key inflection zone R1 44,018 First bullish breakout Read More…
Bitcoin Correction Is Over – New Highs In Sight?
Previous Analysis Recap (April 22nd) In our last review, we discussed: The key takeaway then was that BTC was setting up for upside provided it could hold above $87,000. As of today, BTC has confirmed that move, clearing resistance, retesting, and pushing higher. Price Update – April 28, 2025 Technical Analysis – Fresh Insights Structure: Read More…
Can Gold Futures (GC) Bullish Run Keep Going?
Context: 2025’s Market Chaos Is Gold’s Fuel Gold’s explosive rally has been fueled by macro turmoil: Gold has outperformed equities, bonds, the dollar, and even oil. That alone demands attention. Technical Analysis – Daily Chart Breakdown Trend Structure: Bullish and Intact Flag Formation or Consolidation at Highs? RSI and Momentum Indicators 🟢 Bullish Case Potential Read More…
NASDAQ Futures (NQ) Dead Cat Bounce?
Current Market Snapshot: Chart Technicals Double Bottom Formation Emerging Downtrend Break Under Scrutiny Moving Averages 🐂 Bullish Scenario If NQ can break and close above the descending trendline and 19,000, we have a confirmed breakout of the short-term downtrend channel. Targets on the upside: This setup would turn the recent price action from a bounce Read More…


