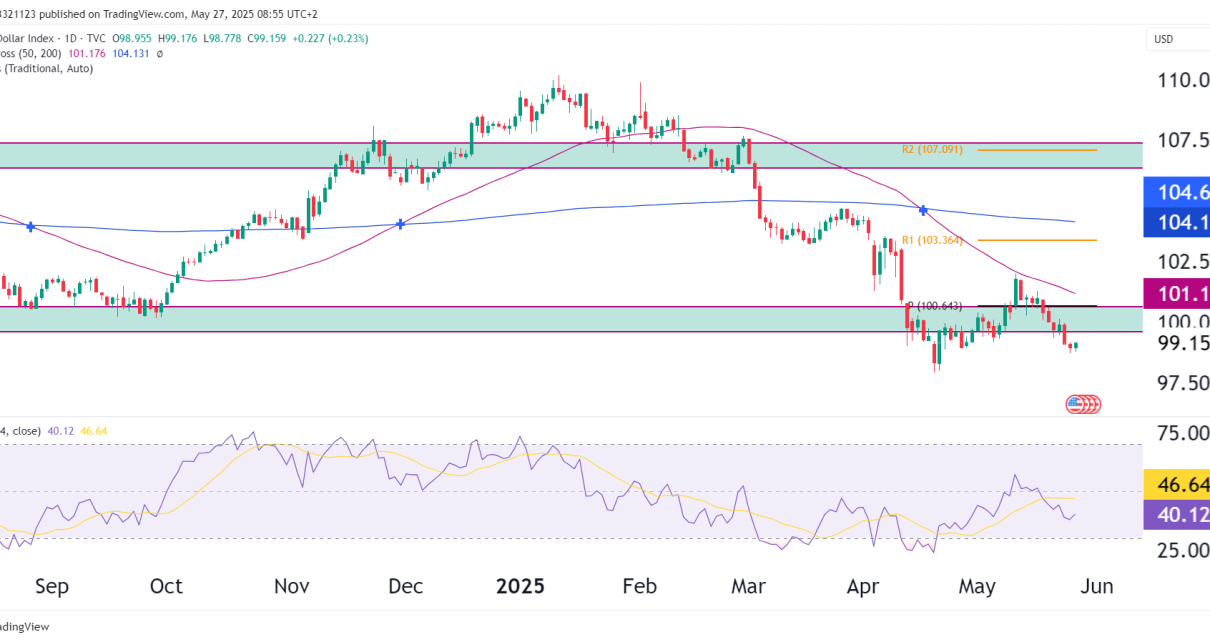
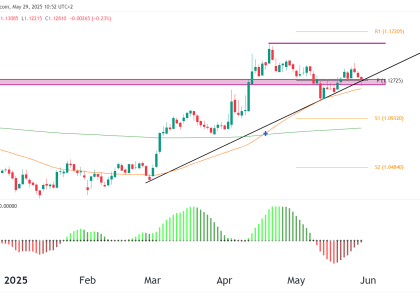
Technical Analysis

E-mini Russell 2000 at pivotal technical level: bearish or bullish?

Introduction The E-Mini Russell 2000 Index Futures, often seen as a bellwether for small-cap stocks in the U.S. market, is currently positioned at a point where it could swing bullish or bullish with volatility. As all markets around the world continue to surge at a time when political and economic unease is high, technical analysis Read More…

Technical Analysis

NASDAQ futures (NQ) under pressure, 100-day moving average in focus

Technical Analysis Moving Averages: Recent Price Action: The price has recently faced resistance near the 50-day moving average as bulls tried to push prices higher and has pulled back slightly. This rejection from the 50-day moving average shows selling pressure at these levels. Market Sentiment: The overall trend before the recent pullback in July was Read More…

Technical Analysis

Bearish momentum in DXY, short trade opportunity – watch 102 resistance

The chart provided displays the U.S. Dollar Index (DXY) on a weekly timeframe. Let’s analyze the technical indicators and identify potential bearish/short high-probability trade opportunities. Technical Analysis Descending Triangle Pattern: There is a symmetrical triangle formation. The price recently broke below the lower trendline of this triangle, signaling a potential continuation of the downtrend since Read More…

Technical Analysis

Australian Dollar Hits Resistance Level

Introduction The Aussy Dollar has been gaining grind like most other currencies as the US Dollar has been weakening. Key Technical Observations: Resistance Level: The price faces strong resistance around the 0.6812 level. This level has been tested multiple times and is holding, suggesting that the bulls are struggling to break through this barrier. Pivot Read More…