

Introduction to the VWMA
The Volume Weighted Moving Average (VWMA) is a powerful technical analysis tool that provides a more accurate representation of an asset’s average price over time compared to a simple moving average. By incorporating trading volume into its calculation, VWMA gives greater weight to periods with higher trading activity, painting a clearer picture of the market’s true sentiment.
In this comprehensive guide, we’ll dive deep into the mechanics of this indicator, see how it differs from other moving averages, and provide practical strategies for applying it to your trading.
What is the Volume Weighted Moving Average?
At its core, the Volume Weighted Moving Average is a type of moving average that factors in both price and volume. While a simple moving average (SMA) treats each time period equally, VWMA recognizes that not all price bars are created equal. It places greater emphasis on periods with heavy trading volume, as these are often more significant in gauging market sentiment and potential trend changes.
Volume Weighted Moving Average Formula
VWMA = Σ(Price * Volume) / Σ(Volume)
Where:
- Σ(Price * Volume) represents the sum of each period’s price multiplied by its corresponding volume over the specified lookback window
- Σ(Volume) is the total cumulative volume across all periods in the lookback window
Let’s break this down with a simple example. Assume we have the following data for a 3-period VWMA:
Day 1: Close = $100, Volume = 1,000
Day 2: Close = $110, Volume = 500
Day 3: Close = $105, Volume = 2,000
To calculate the 3-period VWMA, we first multiply each closing price by its respective volume:
Day 1: $100 * 1,000 = 100,000
Day 2: $110 * 500 = 55,000
Day 3: $105 * 2,000 = 210,000
Next, we sum these price-volume products:
100,000 + 55,000 + 210,000 = 365,000
Then, we calculate the total volume over the three periods:
1,000 + 500 + 2,000 = 3,500
Finally, we divide the sum of the price-volume products by the total volume:
365,000 / 3,500 = $104.29
So in this example, the 3-period VWMA would be $104.29.
The key takeaway here is that the volume weighted average price gives more weight to the $105 closing price on Day 3, as it had significantly higher volume compared to the other periods. This is what differentiates it from a simple average, which would treat each price equally.
Characteristics of VWMA
Because of its volume-weighting mechanism, VWMA behaves differently than a standard moving average. Here are some key characteristics to be aware of:
Faster Reactions to Volume Surges
Since VWMA is more heavily influenced by volume, it will often move more quickly in the direction of high volume price bars. This can make it more responsive to sudden shifts in market sentiment or momentum.
Slower During Low Volume Periods
Conversely, during times of low trading activity, it will tend to lag more than an SMA. With less volume to drive its calculation, it becomes slower to react to price changes.
Smoothing of Price Noise
By factoring in volume, VWMA can help smooth out some of the random noise and whipsaws that can occur on a price chart. It essentially filters the price action through the lens of volume, giving a clearer picture of the underlying trend.
Potential for Volume Spikes to Cause Distortions
One potential drawback is that extremely high volume bars can sometimes skew the average more than warranted. An abnormal volume spike, even if not accompanied by a significant price move, can pull the average aggressively in that direction.
How to Apply VWMA in Trading
Now that we have a better understanding of the volume weighted average price, let’s explore some practical ways to apply it. Many of the techniques used with simple moving averages can be adapted to work with VWMA as well…
Identifying Trends
One of the primary uses of VWMA is to help identify and confirm trends. When price is trading above the line, it indicates an uptrend is in effect. Conversely, price below means there is a downtrend.
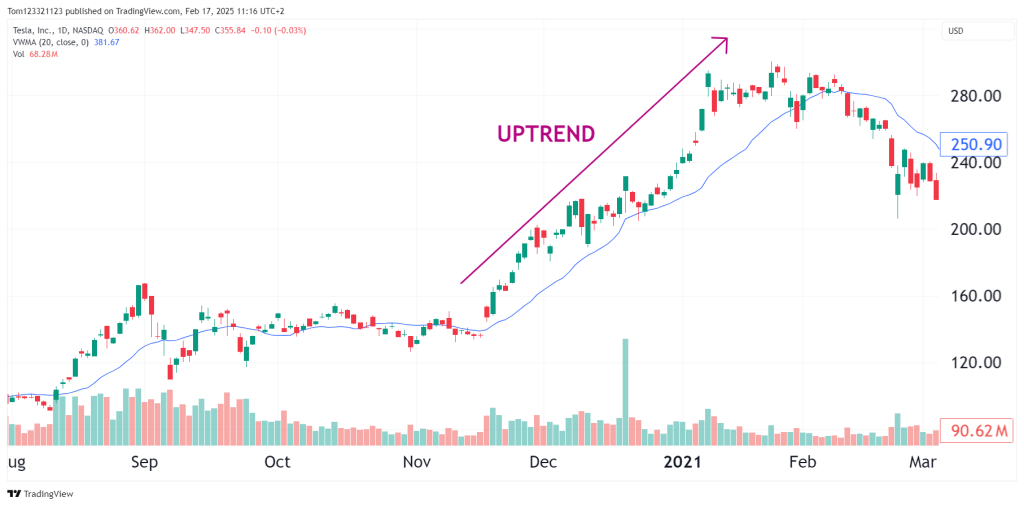
The stronger and more persistent the trend, the more likely price will continue respecting the VWMA as dynamic support (in an uptrend) or resistance (in a downtrend). Traders often look to buy pullbacks in uptrends and sell rallies into it during downtrends.
Spotting Potential Reversals
Crossovers of price and the VWMA can provide early signals of trend change. For example, if price has been trading below the average and then crosses above it, it may be a sign that the downtrend is losing steam and an uptrend could be starting.
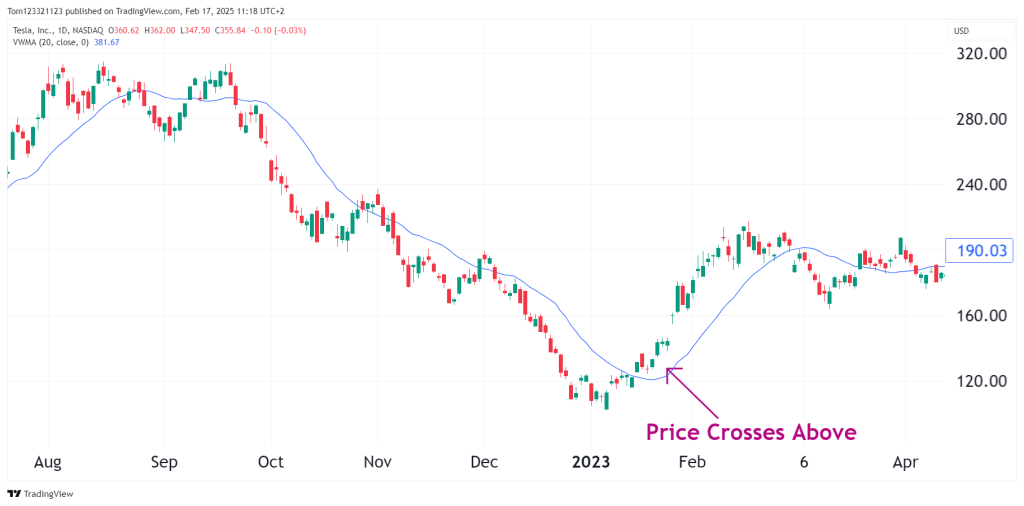
However, it’s important to note that like all moving averages, VWMA is a lagging indicator. Price will always be the first to change direction, with the moving average following suit. As such, VWMA crossovers should be used more as confirmations of trend shifts rather than pure entry signals.
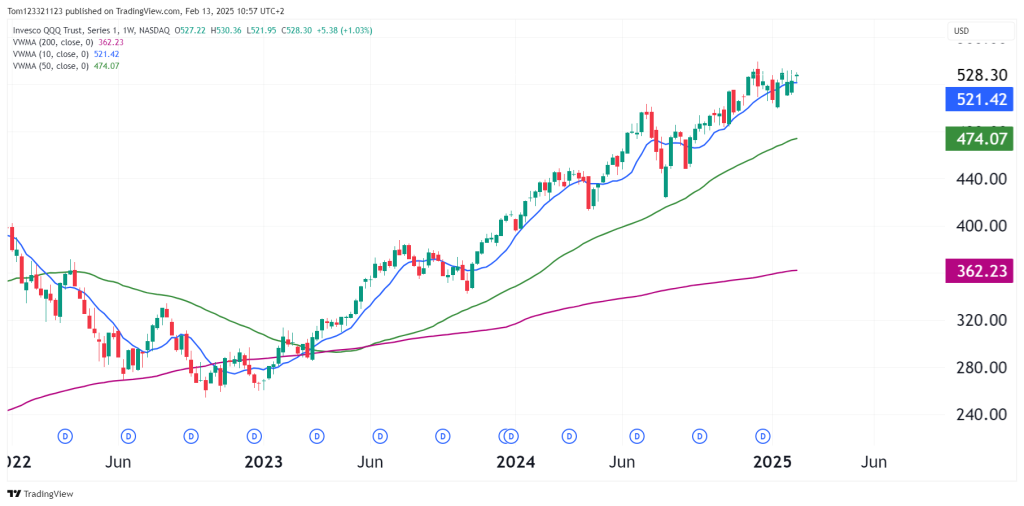
Using Multiple VWMAs
Traders will often plot several VWMAs of different lengths on the same chart to get a more nuanced view of the trend. For example, one might use a short-term (e.g. 10-period), medium-term (e.g. 50-period), and long-term (e.g. 200-period) VWMA.
When the shorter VWMAs are above the longer ones, it indicates a healthy uptrend. The opposite holds true for downtrends. Crossovers of these multiple VWMAs, such as a 10-period crossing above a 50-period, can also be used to generate trading signals.
Incorporating Other Indicators
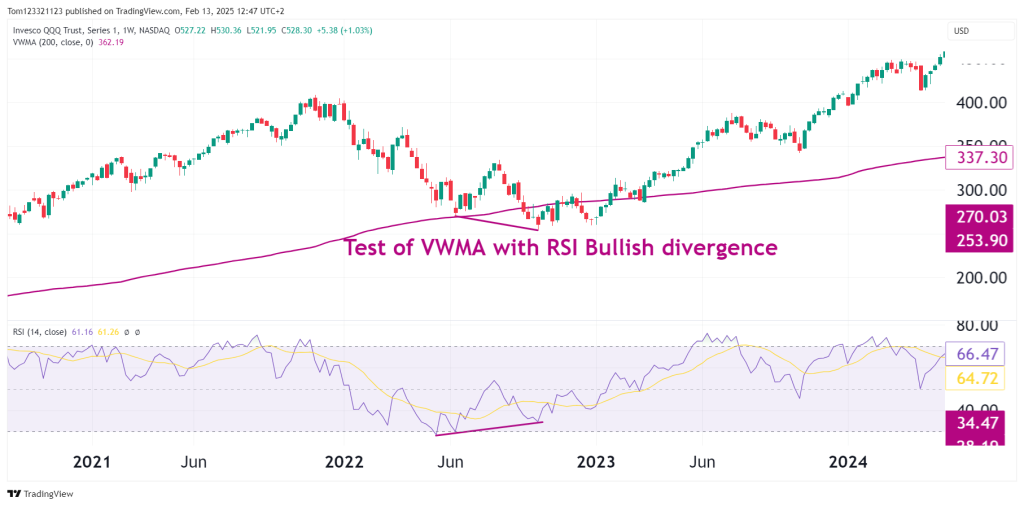
While the volume weighted average price can be a potent tool on its own, it becomes even more powerful when combined with other technical indicators. Many traders will use it as a baseline and then look for confirmations from things like MACD, RSI, or Stochastic before entering a trade.
For example, if price is pulling back to test the VWMA as support during an uptrend, a trader might wait for the RSI to show a bullish divergence before buying. Or if price is rallying into it during a downtrend, a bearish crossover on the MACD could be used as confirmation to sell.
Choosing the Right Settings
Like all moving averages, the VWMA can be calculated using different time periods or “lookback windows”. A 20-day period, for instance, will average the price and volume over the last 20 trading days.
There is no one “correct” setting that works in all markets and timeframes. Shorter VWMAs will be more responsive but also more prone to whipsaws. Longer ones will be slower but smoother.
Traders will use settings that roughly correspond to the timeframe and holding period of their trades. A swing trader operating on the daily chart might use a 20 or 50-period VWMA, while a long-term investor may prefer a 100 or 200-period average.
The key is to experiment with different settings to find what works best for your particular trading style and market. Just be careful of using very low time frames as things generally become more and more difficult the shorter the time frame.
VWMA vs. Simple Moving Average
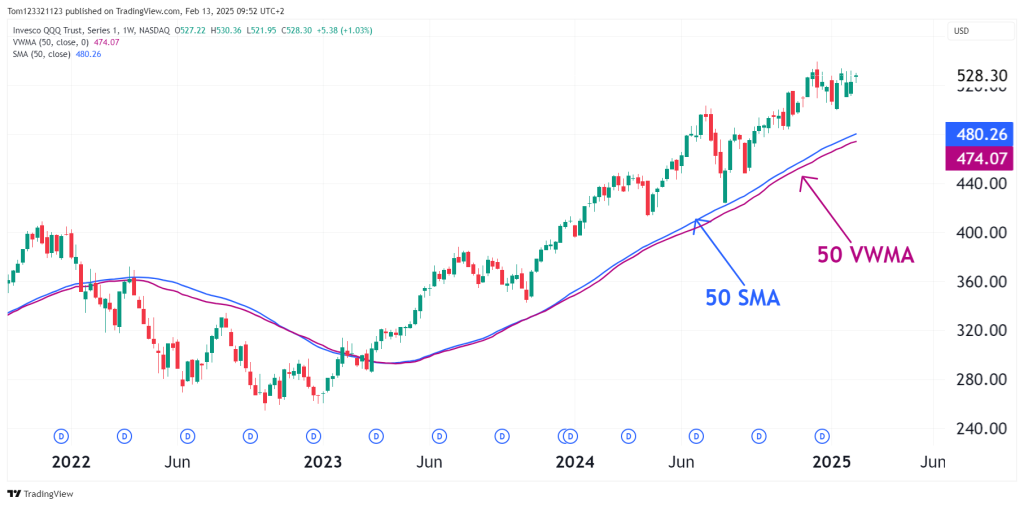
While VWMA and SMA are both moving averages, they have some key differences that are important to understand. The main distinction is that VWMA factors in volume while SMA does not.
What this means in practice is that the indicator will give more weight to price bars that occur on high volume, while SMA will treat all price bars equally regardless of volume. This can lead to some significant divergences between the two averages.
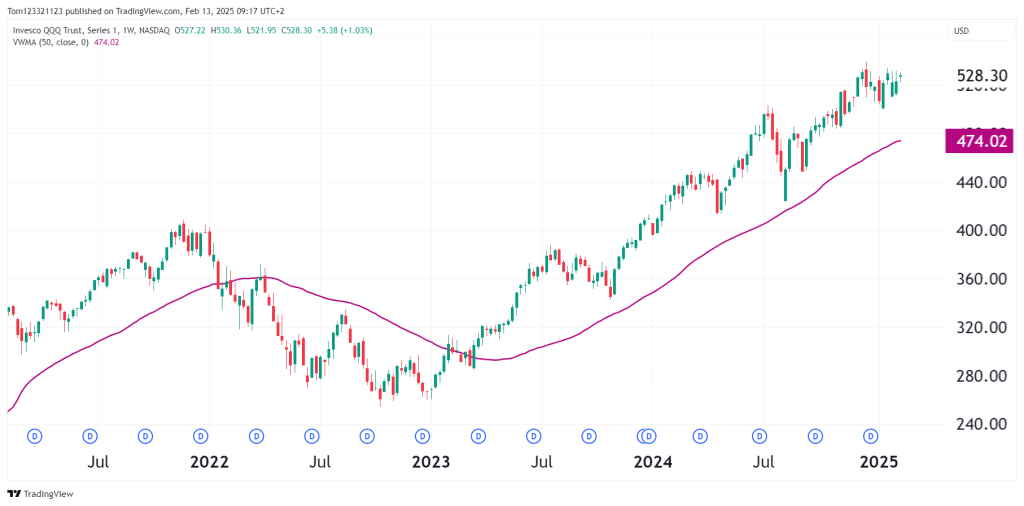
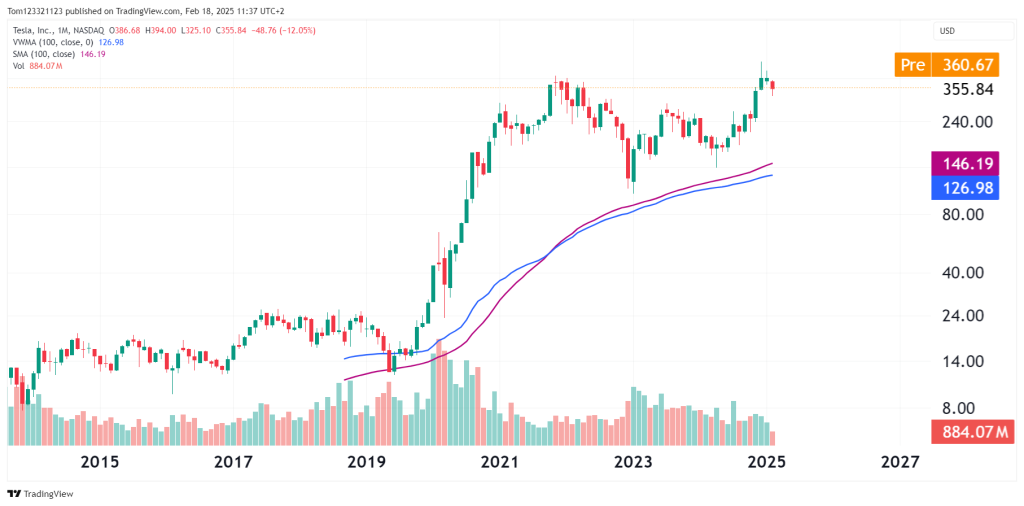
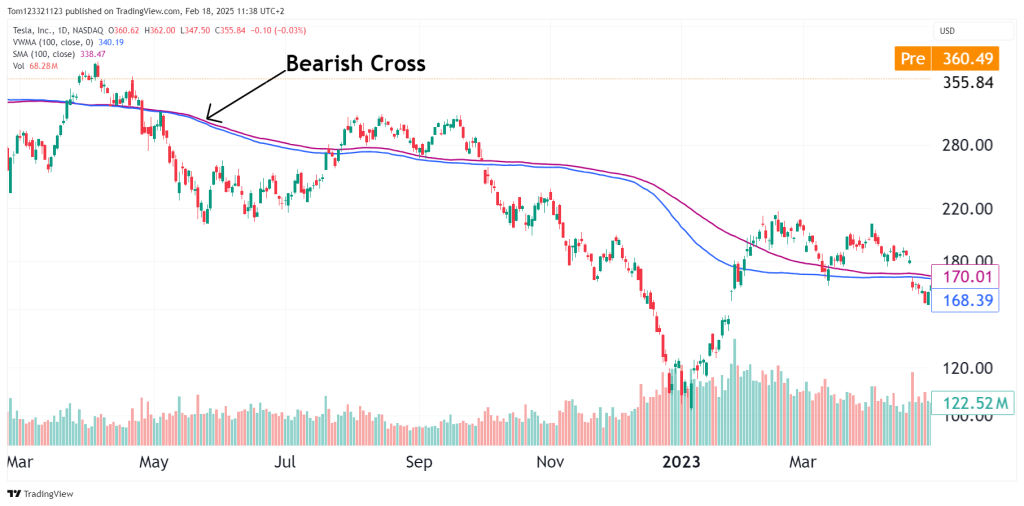
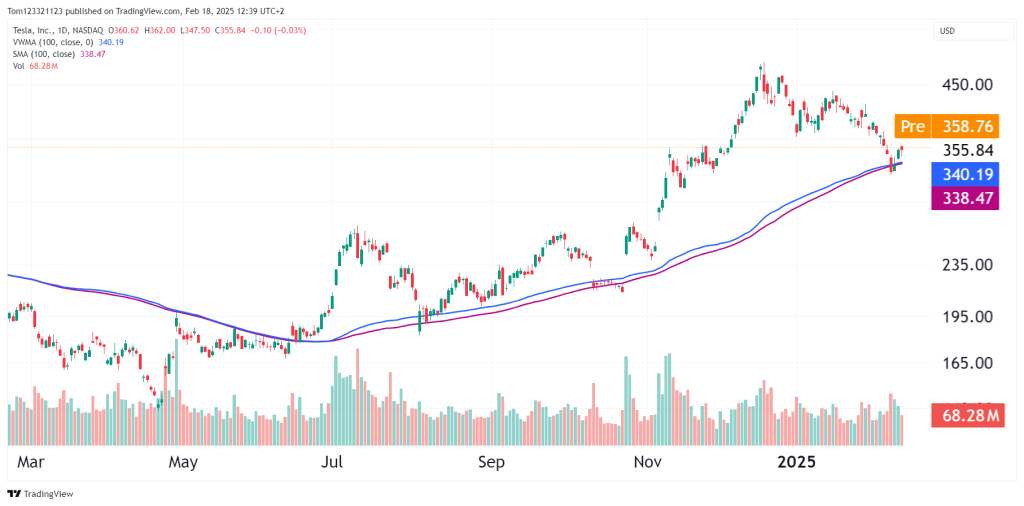
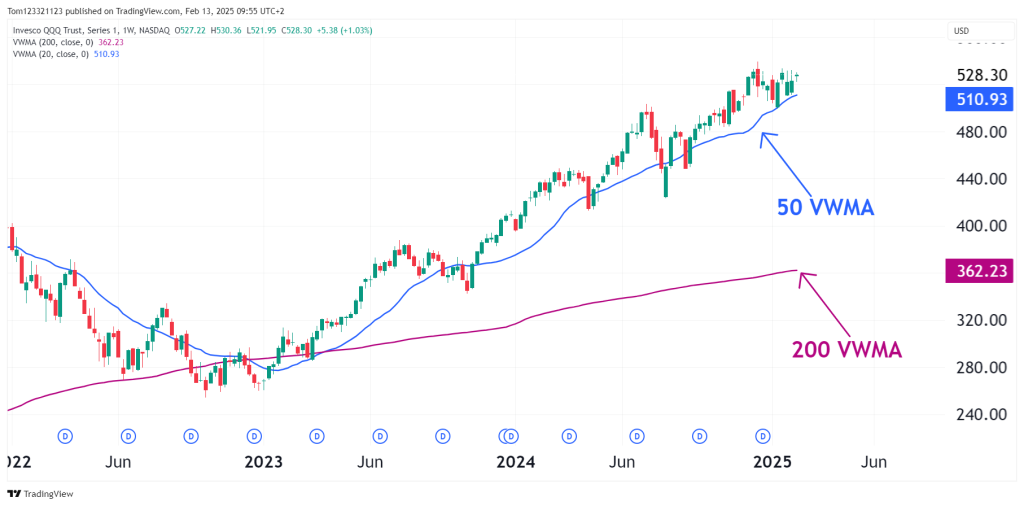
During periods of increasing volume, VWMA will lead the SMA as shown in the chart above. That’s because the higher volume price bars will pull the VWMA in their direction more forcefully. The opposite occurs when volume is declining – here, SMA will often lead VWMA as the impact of the low volume bars is felt more strongly on the non-volume weighted average.
Another difference is that because it factors in an additional data point (volume), it is often considered a slightly “slower” or more lagging indicator compared to SMA. This is more noticeable on longer timeframes and when using longer lookback windows.
So which one is “better”? The truth is, neither is inherently superior – they each provide a different perspective on the market. Many traders find it helpful to use both, as the interplay between the two can offer valuable insights.
For example, if VWMA is significantly above SMA and the spread between them is widening, it suggests the uptrend is seeing increasing volume and momentum. If VWMA is below SMA and the gap is growing, it points to mounting selling pressure.
Crossovers between VWMA and SMA can also be used as trading signals, similar to how one might use crossovers between two SMAs of different lengths. A common strategy is to look for bullish crossovers (VWMA crossing above SMA) to buy and bearish crossovers (VWMA crossing below SMA) to sell.
Limitations of VWMA
While the Volume Weighted Moving Average is a versatile indicator when used correctly, it’s not without its limitations. As with any technical analysis tool, it’s important to be aware of these drawbacks to avoid misusing or overrelying on it.
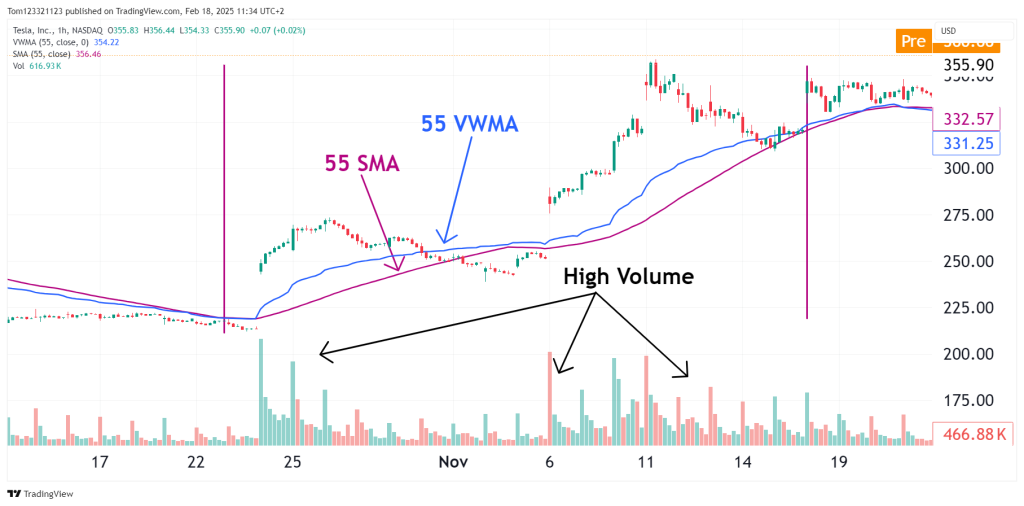
Vulnerability to Volume Spikes
One of the key strengths of this indicator – its sensitivity to volume – can also be a potential weakness. An extremely high volume bar, even if not accompanied by a significant price move, can distort the average and give false signals.
For example, imagine a futures contract that trades a steady volume of around 1 million contracts per day. If it suddenly sees a day with 50 million contracts traded, that single bar will dramatically pull the VWMA in its direction, even if the price action was not particularly noteworthy. This can lead to whipsaws or false breakouts.
Lagging Nature
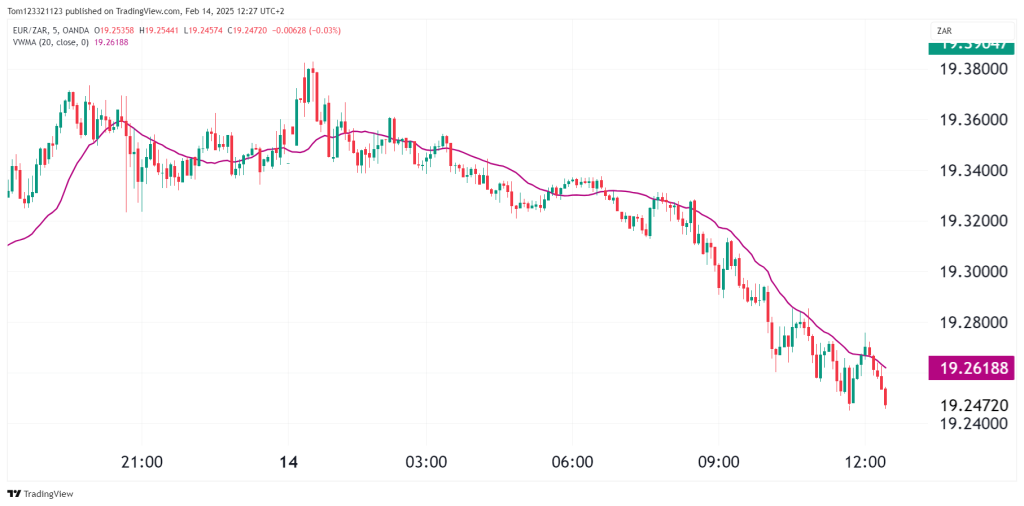
Like all moving averages, VWMA is a lagging indicator. It can only react to price and volume after the fact, not predict them. This means that by the time it generates a signal, a significant portion of the move may have already occurred. It also slightly lags its corresponding simple moving average as we can see in the chart below.
This lag is more pronounced when using longer lookback periods or applying VWMA to higher timeframes. A 200-day VWMA on the daily chart will be much slower to react than a 20-period VWMA on a 5-minute chart.
As such, volume weighted average price is often best used as a confirmation tool rather than a leading indicator. It can help validate trends and provide support/resistance levels, but it’s not well-suited for predicting precise turning points in the market.
Lack of Directional Insight
Another limitation of VWMA is that it doesn’t provide any insight into the direction of the volume. It treats all volume equally, whether it’s buying volume or selling volume.
In practice, a high-volume bar with a small range (i.e., a small difference between the high and low) will impact the VWMA just as much as a high-volume bar with a large range. But these two scenarios can have very different implications for future price action.
High volume with a small range often indicates a balance between buyers and sellers and can signal a potential turning point. High volume with a large range, on the other hand, suggests strong directional conviction and often occurs in the middle of trends.
VWMA doesn’t differentiate between these scenarios, which is why many traders use it in conjunction with other volume-based indicators like the Volume Profile or on-balance volume.
VWMA is Not a Standalone Tool
Perhaps the most important thing to understand about this indicator, or any technical indicator for that matter, is that it’s not a magic bullet. No single indicator can consistently predict market movements or generate profitable trades on its own.
Volume weighted average price is just one tool in the technical trader’s toolbox. It provides a unique perspective on price action and can be incredibly valuable when used correctly. But it should never be relied upon in isolation.
The most effective trading strategies typically combine multiple indicators, each providing a different insight. For example, a trader might use VWMA to identify the overall trend direction, Fibonacci levels to plot potential support/resistance zones, and RSI to gauge momentum.
By looking for confluences between these different tools, traders can build a more robust and nuanced understanding of the market. They can enter trades with more confidence when multiple indicators are aligned, and avoid trades when the signals are mixed.
Conclusion
The Volume Weighted Moving Average is a powerful tool that offers a unique perspective on price action. By factoring in volume, it provides a more accurate representation of the market’s underlying dynamics compared to a simple price-based average.
VWMA can be used to identify trends, spot potential reversals, and gauge the strength of moves. It can also be combined with other technical indicators to build comprehensive trading strategies.
However, like all technical tools, VWMA has its limitations. It can be skewed by volume spikes, it lags price, and it doesn’t provide directional insight. As such, it should be used as part of a broader analysis framework, not as a standalone signal generator.
Ultimately, the key to successful trading with the volume weighted average price indicator, or any indicator, is understanding its strengths and weaknesses. By knowing what it can and cannot do, you can apply it in the correct contexts and interpret its signals accurately.
