

Introduction
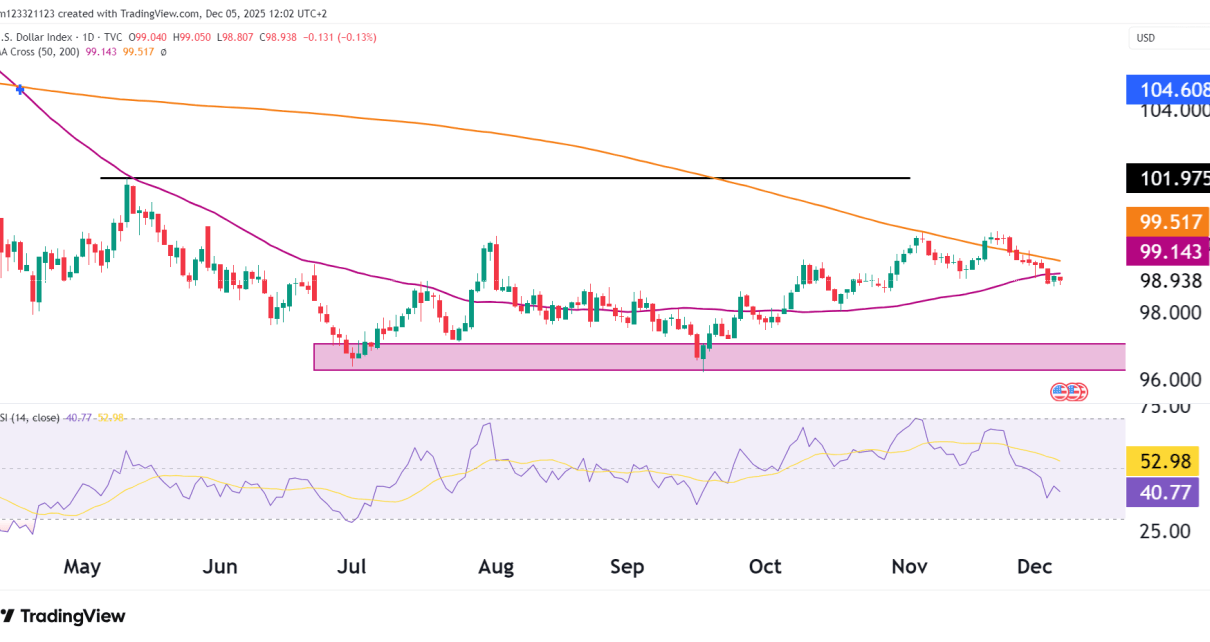
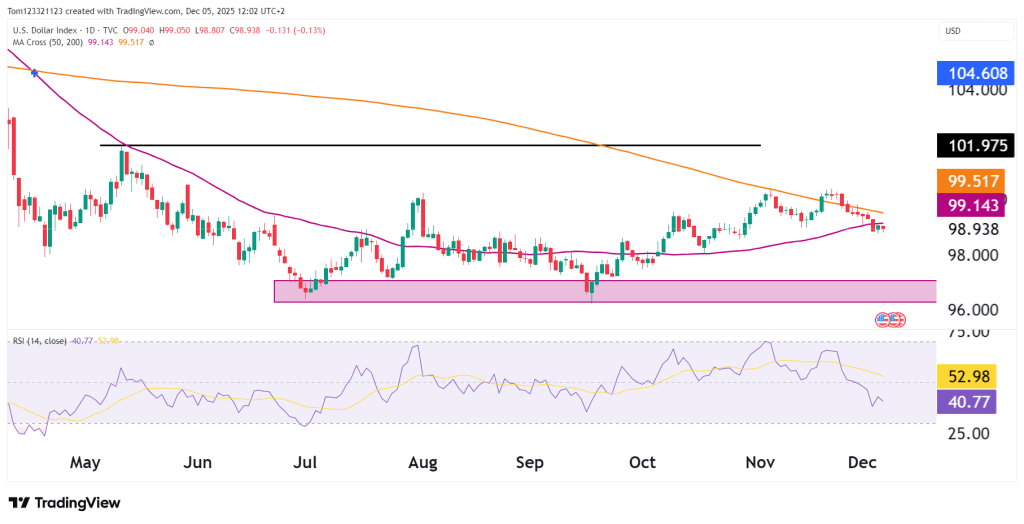
The U.S. Dollar Index (DXY) has fallen back slightly after rallying 4.4% since September. The 50-day moving average has held the price for the moment, which could lead to a new push back up toward 100. The 50 and 200-day moving averages are also converging, and if the 50 crosses above the 200, it would be even more positive for the bulls.
Let’s break down what the chart is currently telling us.
Technical Overview
Breakdown below both major moving averages
DXY is now trading beneath:
- 200-day MA: 99.518
- 50-day MA: 99.144
As we mentioned above, if the 50 moving average crosses back above the 200 and we see price remaining above both, it could lead to renewed bullish momentum.
Momentum has shifted from bullish to neutral–bearish.
RSI shows continued bearish momentum
- RSI: 41.65
RSI sits firmly below the midline (50), confirming bearish pressure.
There are no bullish divergences yet.
Major support sits lower at 96.00–97.00
This long-term support band has acted as:
- Historical demand (July–October lows)
- A multi-month consolidation floor
- A high-volume node where large buyers previously stepped in
If DXY continues lower, this is the next meaningful area to watch.
Key Technical Levels
Resistance
- 99.15–99.50 → 50-day & 200-day MAs / immediate resistance
- 100.00 → Psychological round number
- 101.00–101.97 → Major resistance zone / failed breakout area
Support
- 98.60–98.80 → Current minor support
- 97.50 → October swing low
- 96.00–97.00 → Multi-month support zone / major demand
Probability Table (Next 2–3 Weeks)
| Scenario | Estimated Probability | Notes |
|---|---|---|
| Continuation lower toward 97.50–97.00 | 55% | Price below both MAs, RSI weak, short-term trend bearish. |
| Sideways consolidation between 98.50–99.50 | 30% | Could occur if yields stabilize or market awaits key economic data. |
| Bullish reversal back above 99.50 → retest 100.00+ | 15% | Would require renewed demand for USD or a spike in global risk-off flows. |
Summary
The U.S. Dollar Index has turned weak after falling below both the 50-day and 200-day moving averages. Momentum is bearish, the short-term trend is heading lower, and RSI supports the downside move. Unless DXY can quickly climb back above 99.50, it is more likely to drift toward 97.50–97.00, with a bigger support zone at 96.00–97.00.
The bigger trend is still unclear, but the short-term view points to a softer dollar.
This analysis is for educational and informational purposes only and does not constitute trading advice or a recommendation to buy or sell any futures contracts. Futures trading involves significant risk and may not be suitable for all investors. Always conduct your own research and consult with a licensed financial professional before making trading decisions.