

Introduction
The Dollar index (DXY) dropped 9.3% in 2025, mainly due to the U.S interest rate advantage fading as global growth and risk appetite improved. This meant money flowed elsewhere. It has also been a factor that has helped US indices to rally, with the S&P 500 rallying 16.8% for the year.
Let’s take a closer look at the technicals and what they are telling us.
Weekly Chart

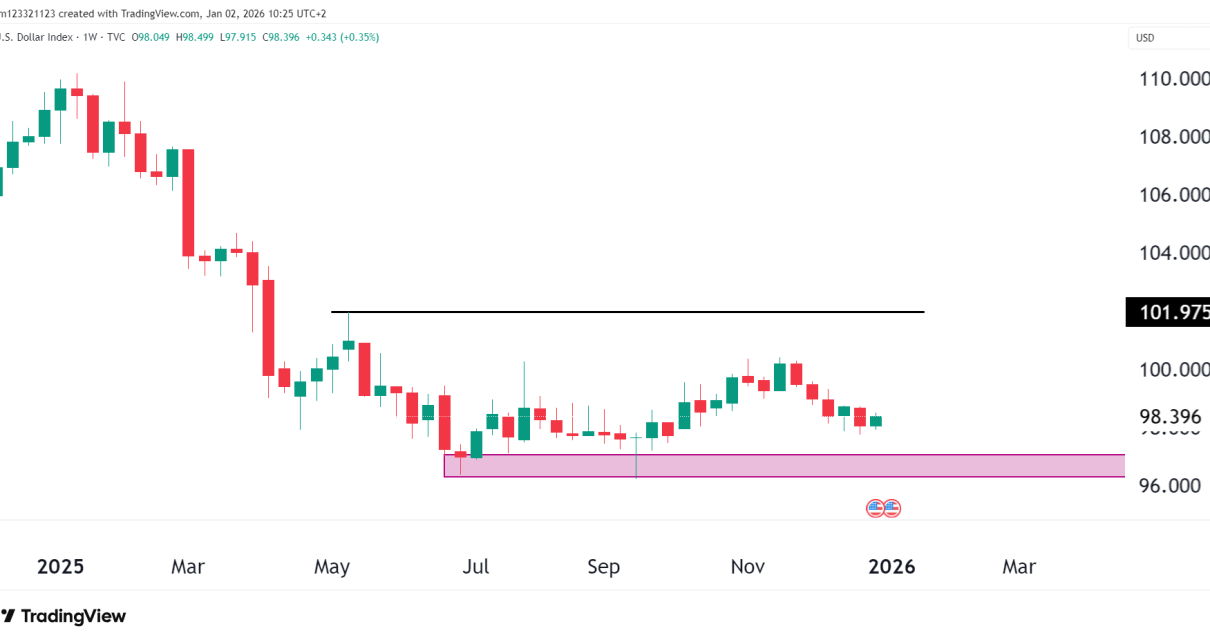
On the weekly chart, the sell-off happened at the start of the year, and the price began to consolidate from May to December. There was a short-term rally where the price went to $100, but sellers stepped in swiftly after that, leading to the consolidation that we are seeing now.
Bulls and bears will likely be pushing the price between $97 and $101 for the first quarter of 2026.
Daily Chart Structure
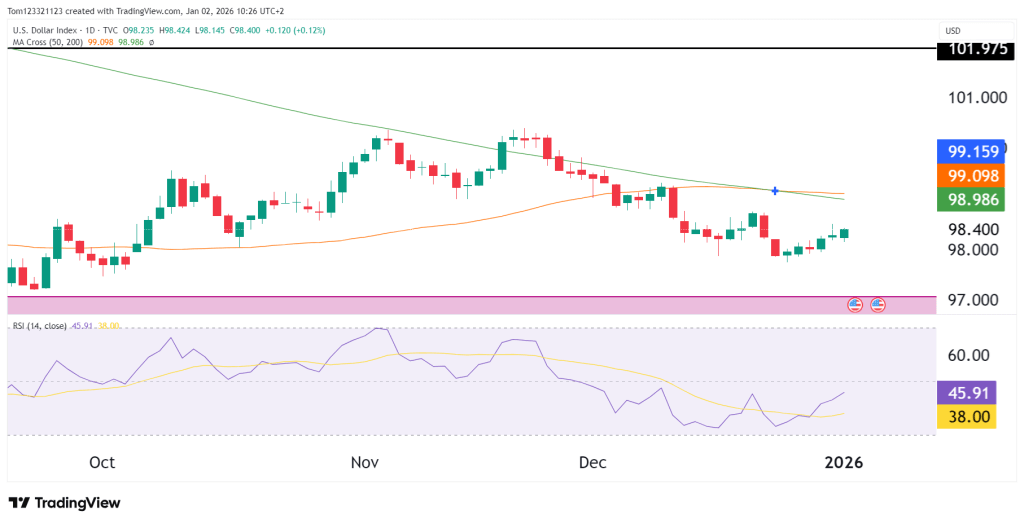
On the daily timeframe, DXY remains below both the 50 and the 200 moving average. The 50 MA crossed above the 200 recently, which could lead to a small rally in the short term toward the 99 price level. We can expect some resistance at that level as both MAs are joined at that price.
The 96.00–97.00 zone has been tested multiple times and continues to hold as a key support area. As long as price remains above this zone, downside pressure is contained, but the lack of follow-through above resistance keeps the dollar vulnerable to renewed weakness.
Key Technical Levels
- Resistance
- 99.00–99.20: 50-day MA / descending trendline
- 101.97: Major weekly resistance and former breakdown level
- Support
- 96.00–96.50: Multi-month base and key demand zone
- 94.50: Next downside level if 96 fails
RSI
RSI on the daily chart remains below 50, reflecting weak momentum and a lack of strong bullish conviction. While momentum has stabilized from oversold conditions, it has not yet flipped decisively bullish, supporting the idea that the dollar is still in a corrective phase rather than a new uptrend.
Technical Scenarios
- Range continuation:
DXY continues oscillating between 96 and 99 as the market waits for a clearer direction. - Bullish recovery attempt:
A sustained move above 99.20 would be the first sign of trend improvement and could open the door for a test of 101.97. - Renewed downside:
A decisive break below 96 would likely expose the mid-94s and confirm continuation of the broader downtrend.
Estimated Probabilities
| Scenario | Description | Estimated Probability |
|---|---|---|
| Range-bound consolidation | Price holds between 96–99 | 45% |
| Bullish rebound | Break above 99 toward 102 | 30% |
| Bearish continuation | Breakdown below 96 | 25% |
Fundamentals
From a fundamental perspective, DXY remains heavily influenced by Federal Reserve policy expectations, U.S. inflation data, and Treasury yields. Expectations for rate cuts later in 2026 have weighed on the dollar, while any upside surprises in inflation or labor data could temporarily support it.
Key upcoming news events include U.S. CPI, employment data, and Fed communications.
This analysis is for educational and informational purposes only and does not constitute trading advice or a recommendation to buy or sell any futures contracts. Futures trading involves significant risk and may not be suitable for all investors. Always conduct your own research and consult with a licensed financial professional before making trading decisions.


