

Introduction
The U.S. Dollar Index (DXY) has declined sharply from its late-2025 highs, dropping 4%, falling back into the 96–97 support zone that has been a strong floor for the bulls. The drop was sudden and was primarily driven by market concern over the Trump administration’s policies.
This is a critical moment for DXY. How price behaves here will help determine whether the dollar is stabilizing within a broader range or if price remains below the support zone, could lead to a new bearish move.

Market Summary
- Primary trend: Neutral-to-bearish on a medium-term basis following a failed breakout and sustained lower highs
- Current market regime: Range support test after selling
- Key support: 96–97
- Bias-defining level: 101–102
Why This Matters Right Now
The dollar is weakening at a time when other major markets are making moves:
- Gold is breaking into price discovery
- U.S. equities remain near record highs
- Crude oil is stabilizing and attempting recovery
In this environment, dollar weakness is signalling rotation. As inflation cools and the market prices a less restrictive Fed, the dollar’s yield advantage has eroded. Capital is increasingly flowing into risk assets and real assets rather than seeking safety in cash or dollar-denominated instruments.
Historically, when DXY rolls over from resistance and revisits long-term support during periods of stable growth, it often acts as a tailwind for commodities and global assets.
Market Structure & Trend
Weekly Chart
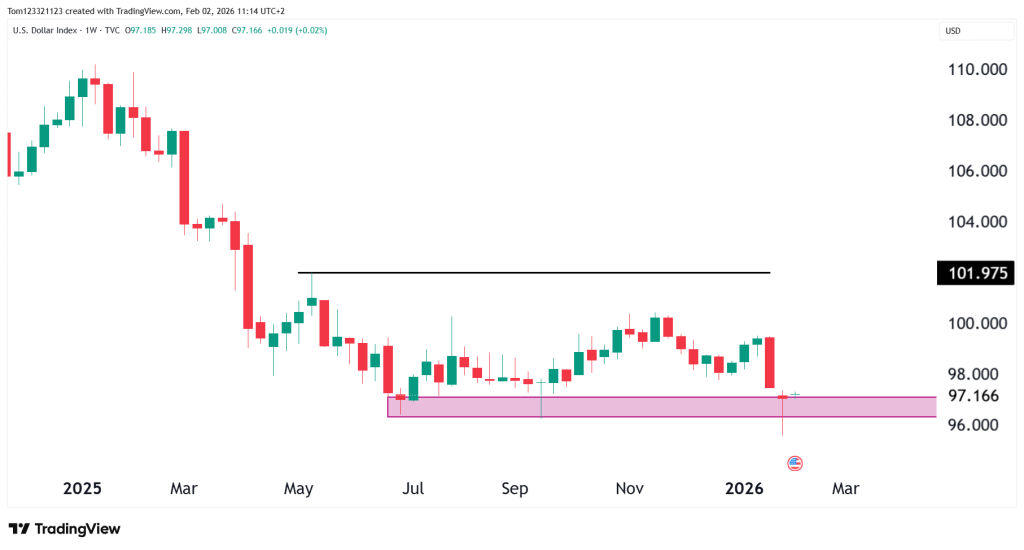
On the weekly chart, DXY has clearly failed to reclaim the 101–102 resistance zone, a level that capped every rally attempt following the prior impulse. This area now represents a major distribution zone, where sellers have consistently overwhelmed buyers.
The candle from last week closed with a big wick on the downside, forming a hammer pattern. This will likely be a difficult test for bears to push below, as the bulls moved in with heavy buying pressure. A red close around the lows or below would signal more strength on the bears’ side.
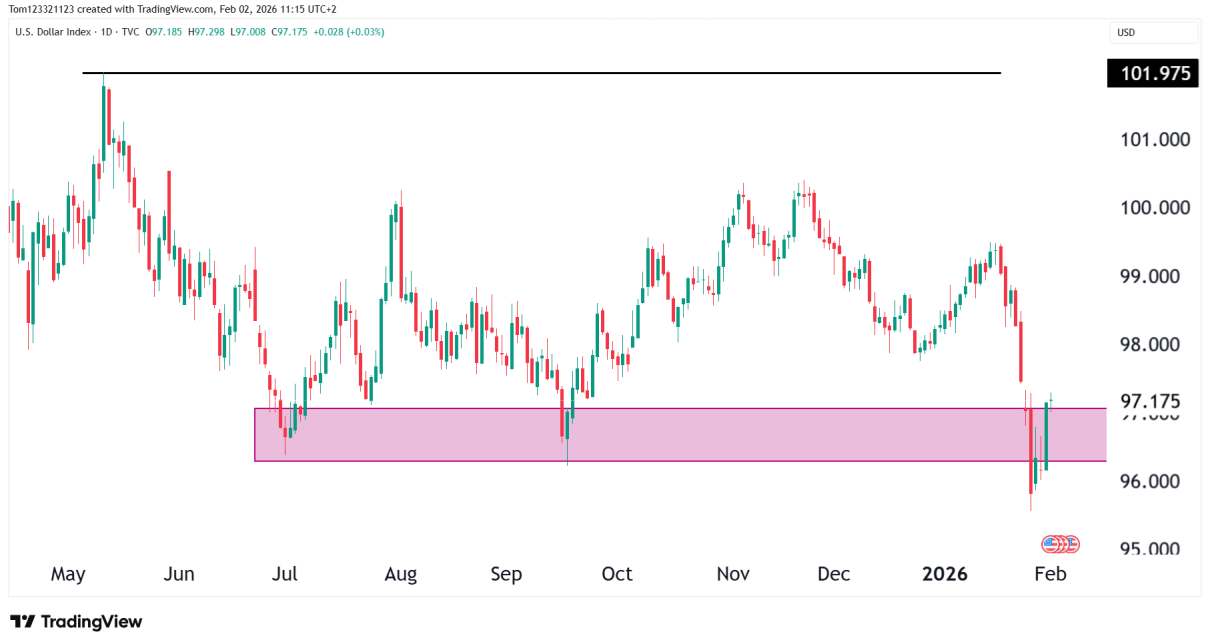
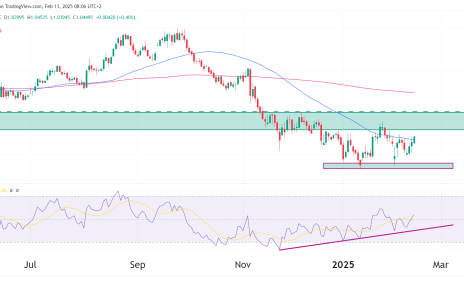
Daily Chart
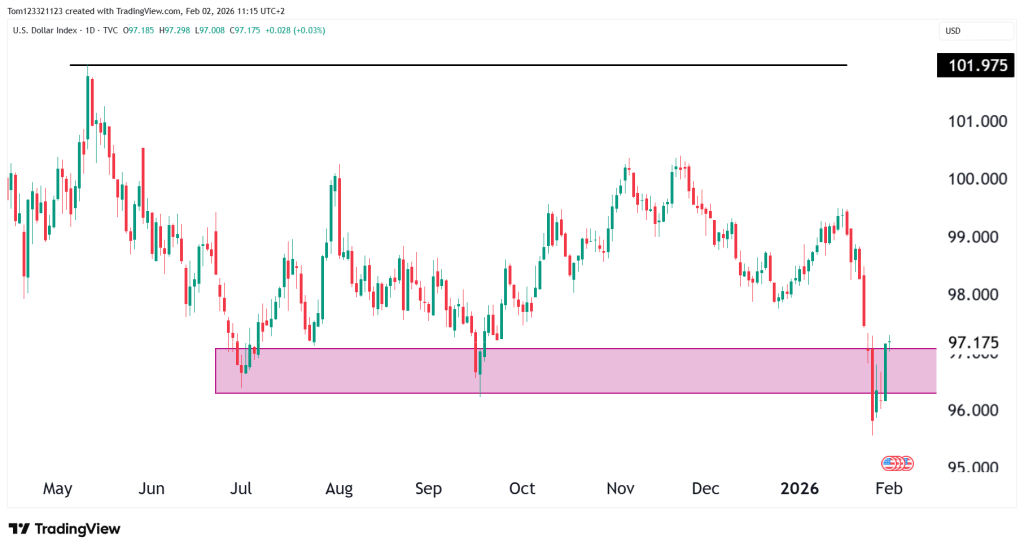
We can see the sell-off more strongly on the daily chart and the amount of volatility that was present. The selling stopped, though, at the support zone, and since it was so sharp, there were no pullbacks for any traders waiting for retracements to enter in on.
Like on the weekly chart, the bears will need to push the price below 96 for there to be a possibility for the downtrend to continue, or the price may get stuck in a wide range.
Macro Drivers Reinforcing the Technicals
The dollar’s recent weakness makes sense when you look at what’s been happening in the macro picture. Expectations around the Federal Reserve have shifted toward eventual easing, which takes away some of the rate advantage that had been supporting the dollar. At the same time, cooler inflation data has strengthened the view that real yields may have already peaked.
Risk sentiment has also improved, and when markets feel calmer, there’s less need to hide in the dollar as a safe haven. On top of that, other central banks, especially in Europe, have started to close the policy gap, which further narrows the dollar’s edge. Once the dollar failed to break higher and slipped out of its range, positioning and technical pressure likely added fuel to the selling.
All of this helps explain why the dollar rolled over at resistance and why buyers are now stepping in to defend long-term support.
Key Technical Levels
Line in the Sand
- 96–97: Critical structural support. Holding this zone keeps DXY in a broad consolidation. A sustained break below would weaken the outlook.
Bias-Defining Levels
- 101–102: Major resistance and prior distribution zone. A reclaim would invalidate the bearish thesis and restore upside potential.
Reference / Extension Levels
- 94–95: Next downside reference if support fails.
- 103+: Upper range extension if the dollar regains strength.
Looking Forward: Scenarios
Stabilization at Support (45%)
DXY holds the 96–97 zone and enters a sideways consolidation, allowing the market to digest macro shifts without further downside acceleration.
Bearish Breakdown (35%)
A decisive weekly close below 96 opens downside risk toward 94–95 and confirms a trend shift lower.
Bullish Reversal (20%)
Unexpectedly strong U.S. data or a repricing of Fed expectations pushes DXY back above 101, reclaiming range resistance and invalidating the breakdown.
Final Takeaway
The U.S. Dollar Index is no longer driving the market. It’s responding to it. After months of trying and failing to push higher, shifting policy expectations and a better risk environment have pushed DXY back into an important support area.
This level matters. It’s not the end of the story, but a point where the next direction gets decided. If the dollar holds here, the impact on gold, commodities, equities, and global liquidity will look very different than if it breaks lower.
Right now, price is sending a simple message: the dollar is under pressure, and what happens next depends on how it behaves at support.
This analysis is for educational and informational purposes only and does not constitute trading advice or a recommendation to buy or sell any futures contracts. Futures trading involves significant risk and may not be suitable for all investors. Always conduct your own research and consult with a licensed financial professional before making trading decisions.