

Introduction
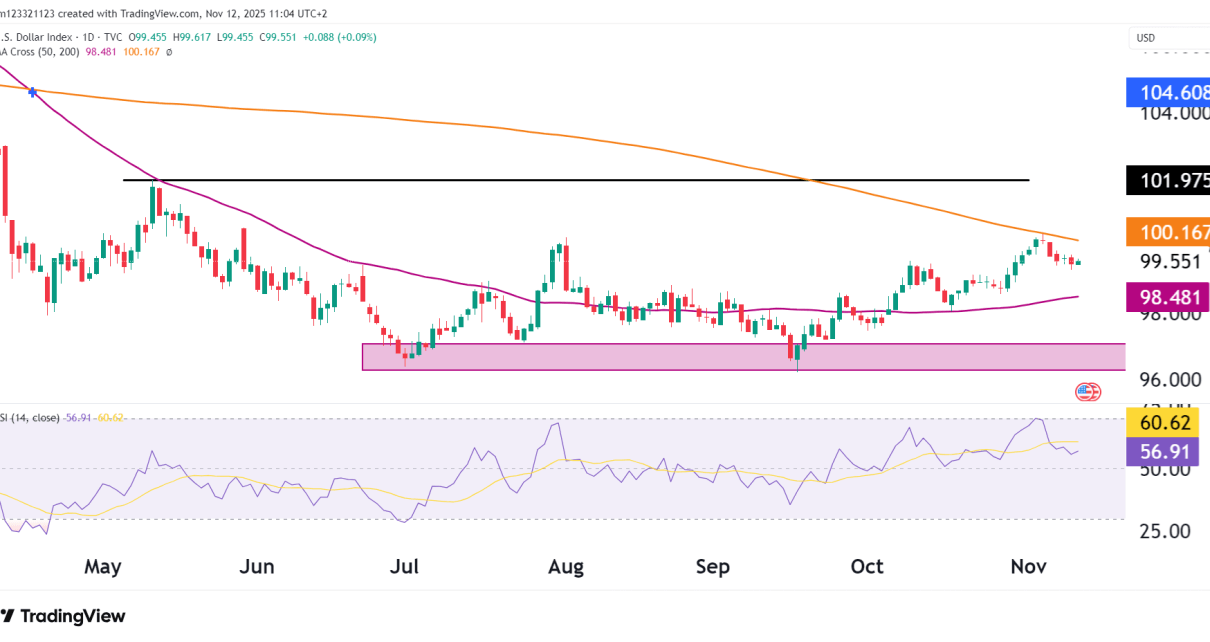
The U.S. Dollar Index (DXY) continued to rally since our previous analysis and tested the 200-day moving average before touching it and retracing slightly. The greenback’s recovery from October lows and support zone has been hopeful for the bulls; now, they will be looking to clear above the 200-day MA to continue with the upward momentum.
Traders are still reassessing the outlook for U.S. rates and global risk sentiment. Let us take a look at the technicals and what they tell us.
Technical Overview For The Dollar
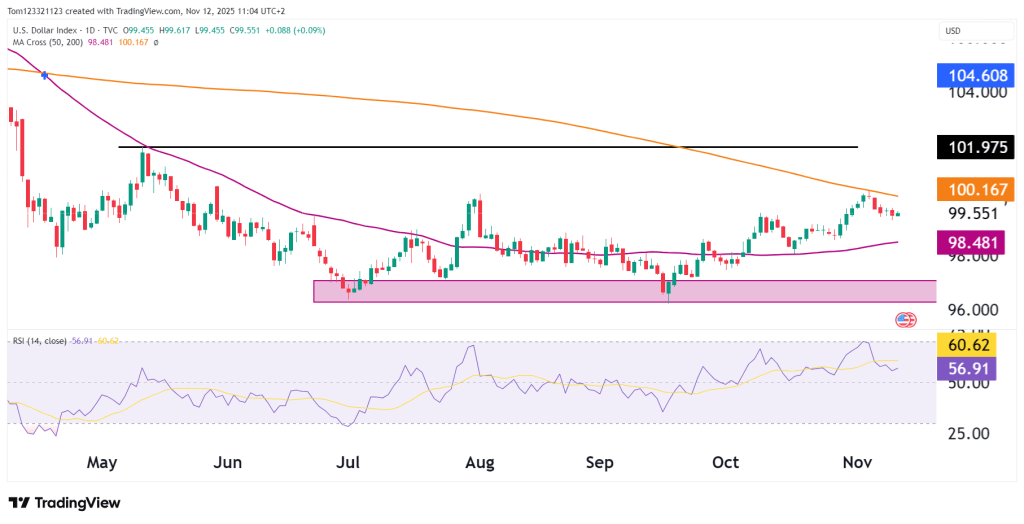
The DXY remains in a neutral-to-recovery phase, holding comfortably above its 50-day moving average (98.48) but unable to reclaim the long-term 200-day average (100.17).
The Dollar has eased slightly after testing 99.95–100.10, signaling fading short-term momentum. A breakout above 100.50 is still needed to confirm a trend reversal and could target the 101.30–101.90 zone.
On the downside, support sits at 98.50 (50-day MA), then 97.50 — October’s key low. A break below that would suggest the rebound is fading, with risk of a drop toward the 96.40–96.50 support base.
For now, the tone has turned cautious, with momentum cooling as markets wait for fresh macro signals.
RSI
The Relative Strength Index (RSI) is a momentum indicator that helps traders spot potential overbought or oversold conditions. It’s a scale from 0 to 100 — readings above 70 often mean an asset is overbought, while readings below 30 indicate it may be oversold.
In this case, the RSI for DXY around 56.91 tells us the dollar isn’t overstretched in either direction. It’s in a neutral zone, meaning the market is still undecided. Traders use RSI in combination with price action and support/resistance levels to better time entries and exits.
Whether you’re analyzing forex trends, the U.S. Dollar Index, or any major currency pair, understanding RSI is a key part of reading market momentum and spotting potential shifts early.
🎯 Ready To Get Funded?
Start your 7-day free $100K evaluation with OneUp Trader and take the first step toward becoming a funded trader.
Start Evaluation Now →Dollar Key Technical Levels
| Type | Level | Description |
|---|---|---|
| Resistance 1 | 100.17 | 200-day MA. |
| Resistance 2 | 101.00 | Psychological resistance. |
| Resistance 3 | 101.90 | R3 pivot. |
| Support 1 | 98.50 | 50-day MA. |
| Support 2 | 97.50 | October low. |
| Support 3 | 96.40 | Long-term base. |
Probability Table (Next 2–3 Weeks)
| Scenario | Estimated Probability | Notes |
|---|---|---|
| Consolidation between 98.50–100.50 | 50% | Most likely outcome as DXY digests gains below 200-day MA. |
| Breakout above 100.50 → 101.50–101.90 | 30% | Requires renewed yield support or hawkish Fed tone. |
| Breakdown below 98.00 → 97.00 | 20% | Possible if risk sentiment improves or inflation data softens. |
Dollar Fundamentals
The U.S. dollar is taking a breather as traders reassess their positions after the recent FOMC meeting and ahead of key U.S. inflation data due later this week. The Fed kept its messaging cautious, signaling that while rates are likely to stay high, any further hikes will depend on the data.
With Treasury yields stabilizing and global risk appetite improving, demand for the dollar as a safe-haven currency has eased. At the same time, gold prices are rebounding, and the euro is showing signs of recovery, hinting at shifting capital flows as investors rebalance portfolios before year-end.
That said, geopolitical tensions and concerns over the U.S. fiscal outlook are still giving the dollar support on pullbacks. If upcoming inflation data comes in hotter than expected — or if Fed officials take a more hawkish tone — the U.S. Dollar Index (DXY) could make another run at breaking above its 200-day moving average.
This analysis is for educational and informational purposes only and does not constitute trading advice or a recommendation to buy or sell any futures contracts. Futures trading involves significant risk and may not be suitable for all investors. Always conduct your own research and consult with a licensed financial professional before making trading decisions.