


Introduction
In the February 17 analysis, ES was trading within a range, with resistance near the 6,950–7,000 zone and support around 6,750–6,800. Momentum was weakening, which was understandable after such a long and tireless rally that we have seen in the US equity markets.
Since then, price has struggled to find the buying power necessary to push into new highs. Time will tell, however, if this consolidation will lead to a stronger bullish break or if the buying pressure is just not there anymore. Betting against this market, however, has not really yielded any results, as an infinite money supply keeps propping up the prices.
Market Structure & Trend
Daily Chart
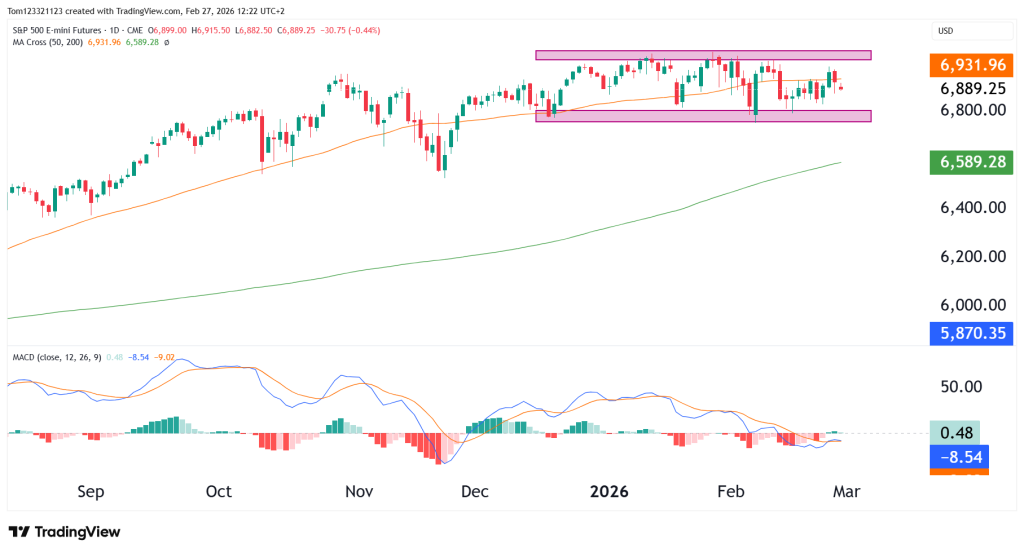
The daily chart shows:
- Clear horizontal resistance at 6,950–7,000
- Defined support at 6,750–6,800
- Price trading around the 50-day moving average (~6,930)
- MACD crossing lower with bearish momentum building
If 6,750 breaks with momentum, that would confirm a short-term shift.
Weekly Chart (Ichimoku Context)
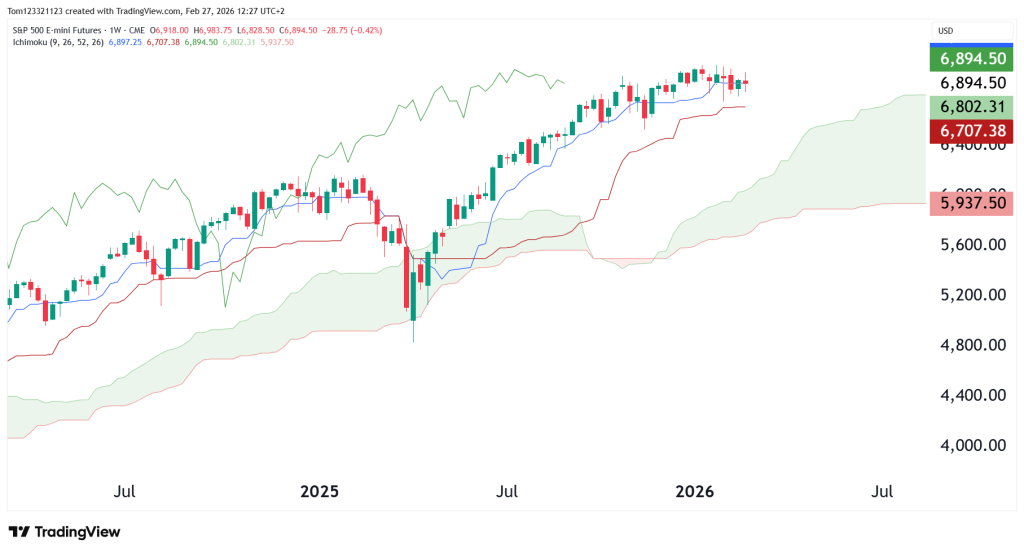
On the weekly timeframe:
- Price remains above the Ichimoku cloud
- Conversion and base lines are flattening
- Momentum has slowed but not reversed
- Broader trend remains bullish
The weekly chart is still showing a lot of bullish strength, but the acceleration is slowing. The overall buying power is lower at the moment, which is to be expected as some profit-taking is entering the market after a lengthy uptrend.
Key Technical Levels
Resistance
6,950–7,000:
Major supply zone. Multiple rejections confirm sellers are active here.
A strong weekly close above 7,000 would invalidate the near-term bearish bias and open upside toward 7,200+.
Support
6,750–6,800:
Range floor and key decision zone.
6,700 (Weekly Tenkan/Kijun region):
If price loses 6,750, this becomes next structural support.
6,590 (200-day MA region):
Major trend support.
As long as ES holds above the 200-day MA, the bullish structure remains intact.
Looking Forward
Bearish Breakdown
A daily close below 6,750 opens downside toward 6,600–6,650 initially.
This would confirm a short-term lower high → lower low sequence.
Continued Range
Price rotates between 6,750 and 7,000 while waiting for macro catalyst.
Bullish Breakout
Above 7,000 resumes primary uptrend and targets 7,200–7,300.
Estimated Probability Table
| Scenario | Description | Estimated Probability |
|---|---|---|
| Range continuation | 6,750–7,000 rotation | 40% |
| Bearish breakdown | Break below 6,750 | 35% |
| Bullish breakout | Weekly close above 7,000 | 25% |
Final Takeaway
ES is no longer in a clear trend. Instead, it’s trading in a tightening range.
The 7,000 level continues to act as strong resistance, with price struggling to move above it. On the downside, 6,750 has become an important support level to watch.
The broader weekly uptrend is still intact, but momentum has slowed noticeably. This puts the market in a decision area, where it’s likely building energy for the next move.
A break above 7,000 or below 6,750 will likely set the direction for the next 300 to 500 point move.
For now, patience makes sense. Periods of consolidation like this are often followed by expansion.
This analysis is for educational and informational purposes only and does not constitute trading advice or a recommendation to buy or sell any futures contracts. Futures trading involves significant risk and may not be suitable for all investors. Always conduct your own research and consult with a licensed financial professional before making trading decisions.

