


Introduction
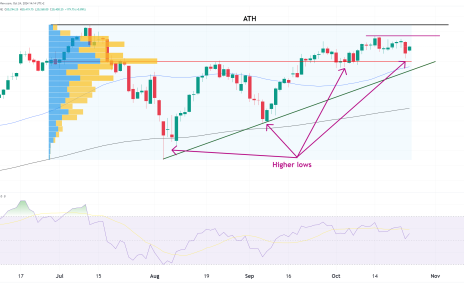
US equity markets continue to rally and ES is no exception. The S&P 500 is trading near all time highs with the daily chart painting higher highs and higher lows. There is optimism around economic growth and an easing of monetary policy which is playing a role in the bullish momentum of ES. The market is closely watching FED guidance as any movement from them, as always, will have a huge impact on the equity markets.
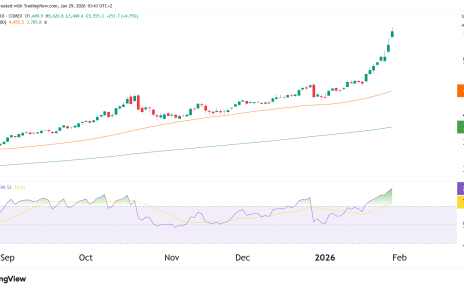
Let’s take a closer look at the technicals and what we can learn from them.
Market Structure & Trend
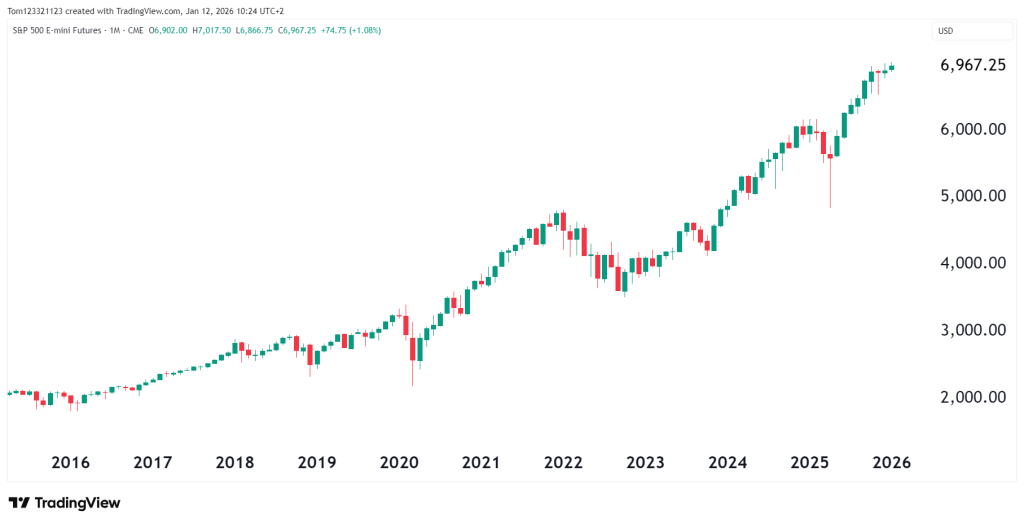
Monthly chart: A strong uptrend with higher highs and minimal pullbacks since the 2023 low. Retracements last no more than 3 months before the bulls reestablish the momentum and push the price higher. Looking back, there has been 8 green candles (months) in the past 9 months of trading.
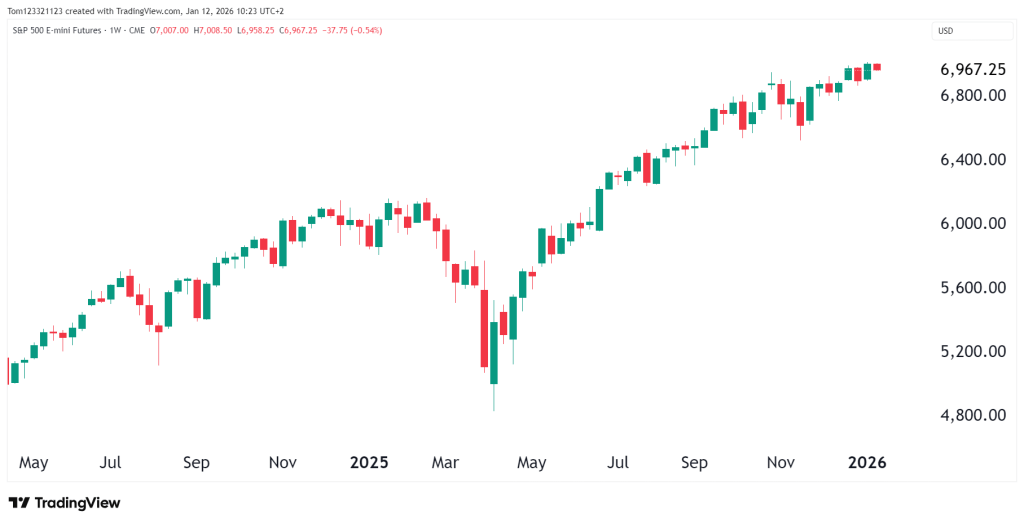
Weekly chart: Price continues to hold above prior breakout levels, with pullbacks remaining shallow and corrective.
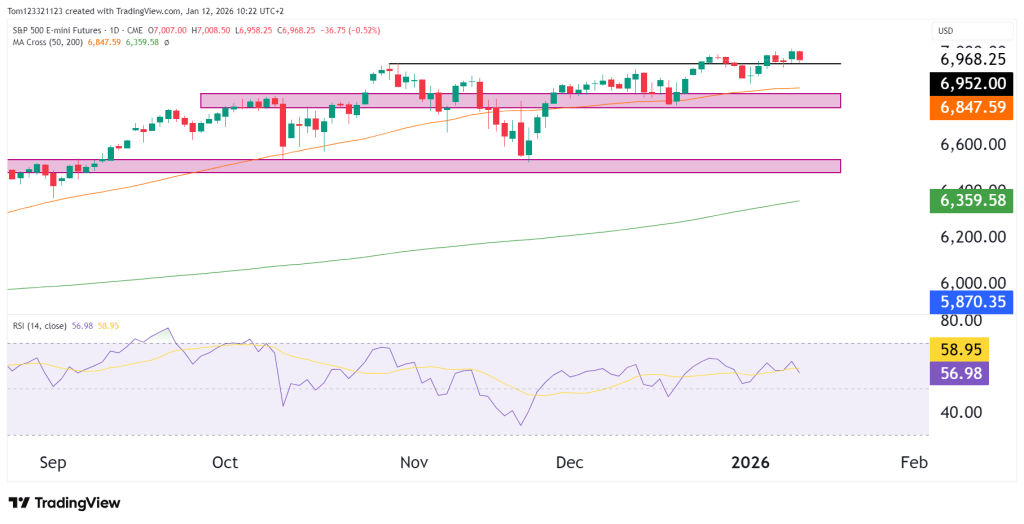
Daily chart: Consolidation is occurring just below recent highs. The 50 MA is also holding as major support which the bulls fight to defend each time price tests it.
Key Technical Levels
Resistance
- 6,980–7,020: Immediate all-time high resistance zone
- 7,100+: Psychological upside extension if price breaks and holds above ATH
A sustained move above 7,000 would open the door for further upside continuation.
Support
- 6,850–6,880: Key breakout and value area
- 6,600–6,650: Deeper structural support from prior consolidation
- 6,360–6,400: Long-term trend support and weekly structure
Momentum (RSI)
The RSI has been mainly holding above the 50 level confirming the bullish momentum of the price action. Any move below the 50 level could be a sign for bulls to start looking for buying opportunities.
Looking Forward
- Bullish continuation:
Acceptance above the ATH leads to trend continuation toward the 7,100+ area. - Sideways consolidation:
Price remains range-bound between 6,850 and 7,000 as the market digests gains. - Deeper pullback:
A break below 6,850 could open a retracement toward the 6,600 support zone while still maintaining the broader uptrend.
Estimated Probability Table
| Scenario | Description | Estimated Probability |
|---|---|---|
| Bullish continuation | Break and hold above ATH | 45% |
| Range consolidation | Holding above 6,850 support | 35% |
| Deeper pullback | Retrace toward 6,600 | 20% |
Fundamentals to Watch
ES is still moving higher, helped by growing expectations that interest rates may come down, companies continuing to post solid earnings, and steady confidence in the overall economy. Investors remain encouraged that growth can hold up even as inflation slowly cools. That said, the market’s mood can shift quickly, especially when new data or comments from policymakers change the outlook.
Right now, markets are watching U.S. inflation numbers, jobs data, and messages from the Federal Reserve very closely. With ES trading near record highs, even small surprises in CPI, PPI, or employment reports could spark bigger price swings. Changes in Treasury yields or shifting expectations around when rate cuts might happen could easily drive short-term volatility and set the tone for the next move.
This analysis is for educational and informational purposes only and does not constitute trading advice or a recommendation to buy or sell any futures contracts. Futures trading involves significant risk and may not be suitable for all investors. Always conduct your own research and consult with a licensed financial professional before making trading decisions.