


Introduction
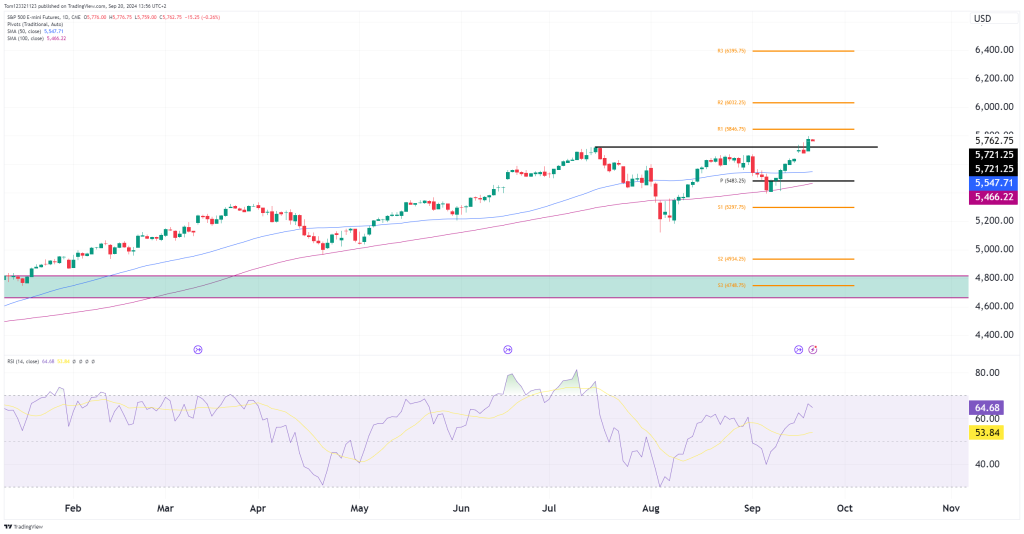
The technical analysis we did a few days ago for ES has now been confirmed, and we are looking like the next upside rally is here. The daily chart confirmed the breakout with a strong bullish close above the previous high, and as long as prices remain above that, bulls should have the upper hand.
Trading Opportunities:
Bullish Trades (Breakout Setup):
- Buy on Breakout: Possible long trade on yesterdays (19 September) Close.
- Stop Loss: Place a stop below 5,600 to protect against a false breakout. If prices trade below this level, the breakout is not strong enough for this setup and probabilities are not high enough.
- Target: Possible targets are at 6,000 and higher and more exit criteria could be if the RSI hits overbought.
Final Call:
- Short-Term (Next Week): Look to remain above the previous all-time high of 5,721 for bullish confirmation.
- Medium-Term (Next 1-2 Months): If the bullish trend continues, targets toward 6,000 are in sight and higher.
- Long-Term (End of Year): As long as the price remains above the 100-day SMA, the broader bullish trend remains intact. Downside risks increase only below 5,450.
