

Current Technical Picture
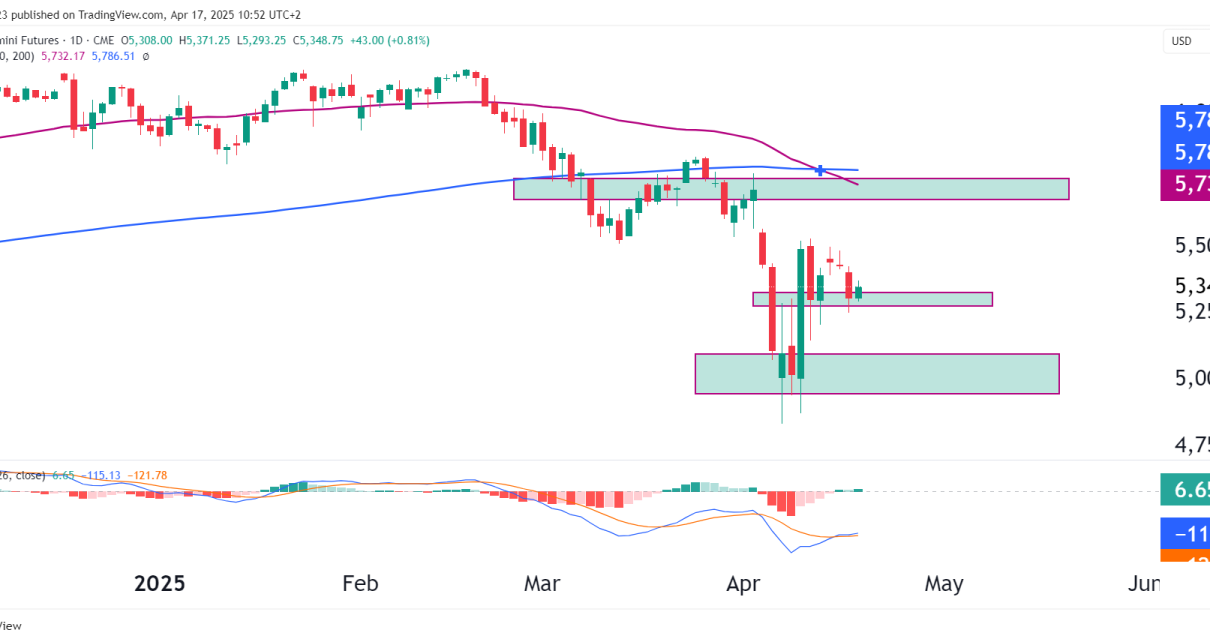
- Current Price: 5,351.75 (+0.87%)
- Moving Averages:
- 50-day SMA: 5,732.23
- 200-day SMA: 5,786.52
- MACD Indicator:
- Histogram has crossed into positive territory (+6.84), showing tentative momentum shifting back toward the bulls.
- Signal lines are curling upward but still below zero, indicating recovery mode, not yet a full bull trend.
What Has Changed Since the Last Analysis?
In our previous breakdown (April 4th analysis), we highlighted:
- The importance of the 5,300–5,350 support zone.
- Potential for a dead cat bounce unless broader macro fears subsided.
- Oversold RSI conditions (RSI had dipped into the 20s).
- Recession fears and tariffs escalating as the major fundamental risks.
Since then:
- Markets bounced aggressively off extreme oversold levels, partially fueled by short-covering and slightly better-than-feared earnings from major banks last week.
- However, price remains trapped well below the 50 and 200 SMA cluster (~5,730–5,785), which now act as major overhead resistance.
- Importantly, MACD has made a bullish crossover, but without strong volume conviction — hinting at a fragile rally.

Key Levels to Watch
- Immediate Support: 5,290 – 5,300 (prior breakdown area)
- Major Support: 5,100 (March lows)
- Immediate Resistance: 5,420 (recent highs) → then 5,730–5,785 zone (50/200 SMA cluster)
- Ultimate Bull Target: Regain and hold above 5,785
Bullish Case
- Technical: MACD positive, higher low formation possibility.
- Fundamentals: Hopes of fiscal stimulus to counteract tariff effects, plus stabilizing real yields.
- Scenario: If ES can break and close above 5,420, it could trigger a move back toward the 50/200 SMAs and challenge major resistance at 5,785. Potential Short-term Upside Target: 5,730 – 5,785
Bearish Case
- Technical: Price still under moving averages, longer-term downtrend structure intact, MACD remains below zero.
- Fundamentals: Persistent inflation concerns, aggressive Fed rhetoric despite slowing data, and geopolitical trade risks (Trump’s tariffs on key allies).
- Scenario: Failure to break 5,420 coupled with a rollover would imply the rally is merely corrective. Potential Short-term Downside Target: 5,100, then 4,950 if recession fears intensify.
Sentiment: Dead Cat Bounce or New Uptrend?
The market has staged a technical recovery, but from a broader macro and technical perspective, this still looks like a dead cat bounce for now.
Reasons:
- No reclaim of major moving averages yet.
- Macro uncertainty remains elevated (tariffs, inflation, slower growth).
- Volume on the rally has been moderate to weak.
However, if we see follow-through above 5,420, and then the reclaim of 5,730–5,785, the probability of a medium-term bottom will rise substantially.
Until then: Caution is warranted.
Summary
| Timeframe | View | Key Level to Watch |
|---|---|---|
| Short Term | Cautiously Bullish | 5,420 Breakout |
| Medium Term | Still Bearish | Needs 5,785 reclaim |
| Long Term | Neutral, tilting Bearish | 5,100 support critical |
