


Introduction
The S&P 500 E-mini Futures (ES) have pulled back slightly after failing to hold recent highs. While the broader trend remains firmly bullish, recent price action shows that upside momentum has slowed and that the market is now testing support.
This pullback comes after an extended rally, and how ES behaves around current support will be important in determining whether this move remains a routine reset or develops into something deeper.
Let’s take a closer look at the technical picture across timeframes.
Market Structure & Trend
Weekly chart
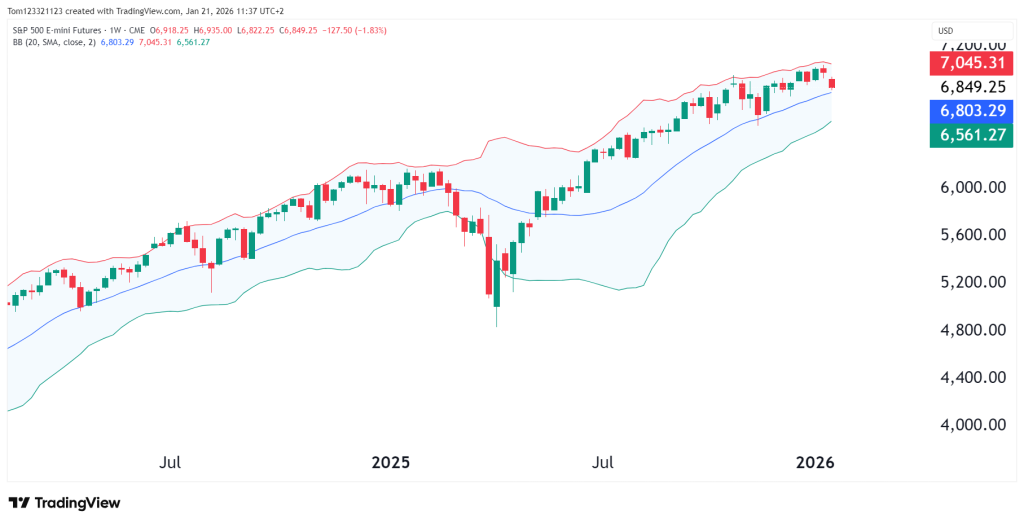
From a higher time frame, the uptrend remains intact.
The weekly chart continues to show clear higher highs and higher lows. Price remains comfortably above the mid-band (20-week SMA) of the Bollinger band, and bulls might see this as a buying opportunity.
Importantly, prior weekly pullbacks during this trend have been corrective rather than impulsive.
At this point, the weekly price structure still supports the existing trend and does not show clear signs of a reversal. That said, momentum has begun to slow as price approaches the upper Bollinger Band. This area often acts as a short-term pressure zone, where buying strength eases and price shifts into consolidation or a controlled pullback rather than continuing straight upward.
An interesting aspect of Bollinger Bands is that they measure volatility, not direction. When price repeatedly presses against the upper band, it usually means volatility has expanded quickly. Markets tend to respond by pausing or compressing volatility before the next move. In many cases, this leads to sideways price action or a shallow retracement that allows momentum to reset, instead of a sharp reversal.
Daily chart
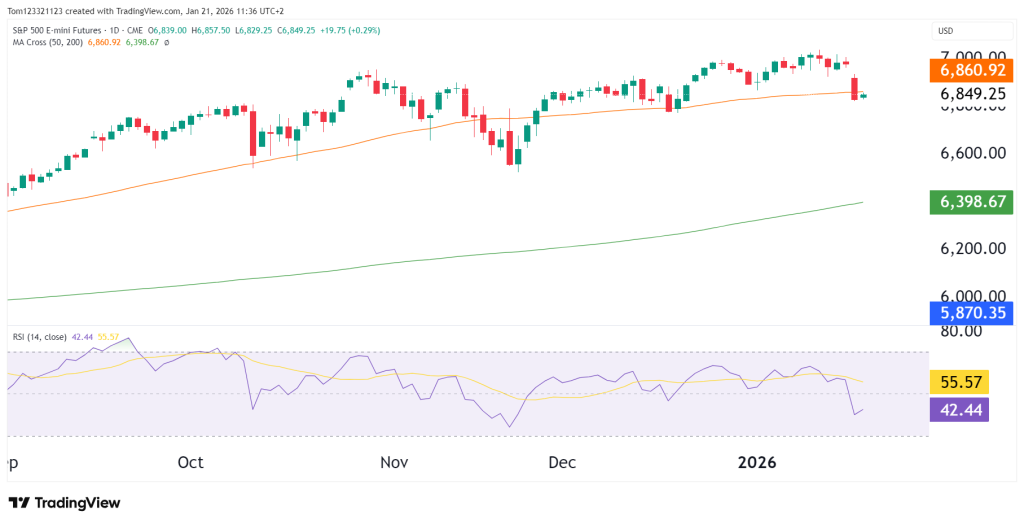
After rolling over from recent highs near the 6,900–7,000 area, ES has pulled back toward the rising 50-day moving average, which is currently acting as first-line support. Price is attempting to stabilize just above this level after a sharp red candle, suggesting that buyers are beginning to respond.
The 200-day moving average remains well below current price, reinforcing the strength of the broader trend and limiting longer-term downside risk for now.
Key Technical Levels
Resistance
- 6,900–7,000: Recent highs and overhead supply
- 7,050+: Psychological upside extension if momentum reaccelerates
A recovery that stalls below 6,900 would likely be viewed as corrective.
Support
- 6,850–6,870: 50-day MA and near-term trend support
- 6,800–6,820: Weekly mid-band and prior consolidation
- 6,550–6,600: Deeper structural support and trend-defining level
A sustained break below the 50-day MA would increase the probability of a test of lower weekly support.
Volatility & Trend Health
The weekly Bollinger Bands remain elevated and upward sloping, a sign that trend volatility is expanding rather than contracting. This suggests that while pullbacks may be sharp, they are still occurring within a healthy trending environment.
Compression or a break below the weekly mid-band would be the first signal that trend conditions are changing more meaningfully.
Looking Forward
Bullish continuation:
Price holds above the 50-day MA and reclaims 6,900, opening the door for another attempt toward the 7,000+ area.
Sideways consolidation:
ES ranges between 6,800 and 6,900, allowing momentum to reset while preserving the broader uptrend.
Deeper pullback:
A decisive break below 6,800 could trigger a move toward the 6,600 support zone, which would still be consistent with a higher-timeframe correction rather than a trend reversal.
Estimated Probability Table
| Scenario | Description | Estimated Probability |
|---|---|---|
| Sideways consolidation | Holding above 6,800 support | 40% |
| Bullish continuation | Reclaiming 6,900+ | 35% |
| Deeper pullback | Retrace toward 6,600 | 25% |
Macro Context to Watch
With ES trading near all-time highs, the market is more sensitive than usual to macroeconomic news. When prices are stretched, even small changes in expectations can have an outsized impact. Inflation reports, movements in Treasury yields, and messaging from the Federal Reserve are likely to drive short-term price swings. If yields begin to rise again or traders start pricing in tighter policy, that pressure could push the current pullback a bit further.
Earnings season adds another layer of uncertainty. While the overall index still looks healthy, leadership within the market matters. If strength continues to rotate between sectors and major names fail to participate, buyers may become more selective. That internal shift can determine whether this dip is quickly bought or whether price stabilizes first before moving higher.
Bottom Line
The S&P 500 remains in a clear long-term uptrend, but short-term momentum has faded. The current pullback is testing trend support rather than breaking it, which is a normal process after a strong advance. The 50-day moving average will be an important reference point, as it often acts as a decision zone for both buyers and sellers.
For now, this move appears corrective rather than a sign of deeper damage. The key question is whether buyers step in and defend current levels. A strong response would reinforce the bullish structure, while hesitation could mean more sideways movement before the next meaningful push.
This analysis is for educational and informational purposes only and does not constitute trading advice or a recommendation to buy or sell any futures contracts. Futures trading involves significant risk and may not be suitable for all investors. Always conduct your own research and consult with a licensed financial professional before making trading decisions.

