Technical Analysis:
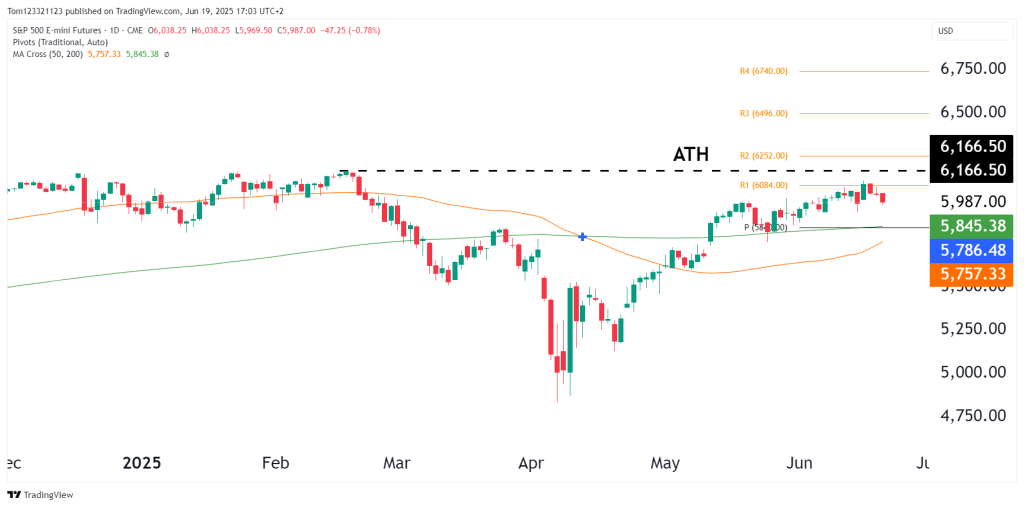
The S&P 500 E-mini futures remain in a tightening range, just beneath their all-time high of 6,166.50. After a strong May rally, price action in June has flattened out into a classic consolidation pattern. Despite brief pushes above the 6,000 mark, the index has failed to follow through with a sustained breakout.
Momentum is softening, though not yet reversing. A clear daily close above 6,166.50 would likely act as a breakout trigger, targeting R2 at 6,252 and potentially R3 at 6,496. Conversely, a breakdown below the 50-day MA would open the door for a test of the 5,757–5,786 support band.
From a trader’s perspective, this is not a market to chase within the range. Instead, positioning near the extremes—with tight risk control—and waiting for breakout confirmation remains the higher-probability strategy. A volatility expansion is brewing.
Support & Resistance:
- Resistance (Ceiling):
- 6,166.50 (ATH): Key level; clear breakout here opens the way to R2: 6,252 and R3: 6,496.
- Support (Floor):
- Immediate: 5,845 (50-day MA and pivot zone)
- Stronger: 5,757 (200-day MA), a break here would mark a momentum shift
Moving Averages:
- 50-day MA: 5,845.38 – holding as near-term dynamic support
- 200-day MA: 5,757.33 – flattening out, but still upward-sloping
- Price remains above both = bullish alignment maintained
Momentum & Risk Gauge:
Upside Catalyst:
- A clean daily close above 6,166.50, ideally on volume, would trigger buy-stop liquidity, opening the path toward 6,250–6,500.
Downside Risk:
- Breakdown below 5,845 (50-day) would open up mean-reversion risk toward 5,786–5,757, where buyers previously stepped in.
Summary Table
| Aspect | Status |
|---|---|
| Trend | Bullish (still intact) |
| Momentum | Cooling/Neutral |
| Volatility | Compression (range-bound) |
| Breakout Trigger | Above 6,166.50 |
| Breakdown Trigger | Below 5,845 |
Final Call:
- Short-Term: Neutral to Cautiously Bullish – wait for breakout confirmation
- Medium-Term: Bullish Bias above 50-day MA
- Long-Term: Still Bullish – supported by macro tailwinds and strong tech leadership
A textbook coil beneath resistance – ES is likely gearing up for a directional move. Traders should stay agile, watching for either a breakout above ATH or a breakdown below the 50-day MA for tactical trades.