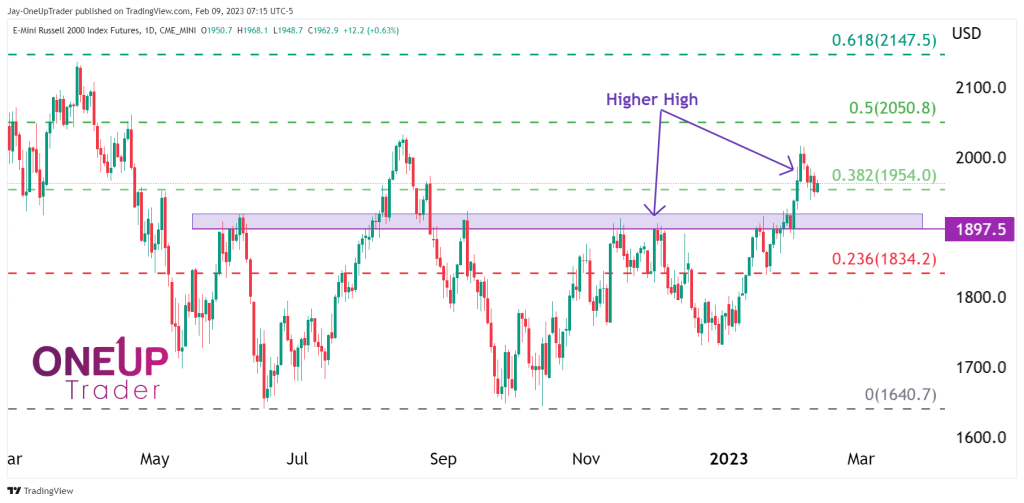
- The trend is now bullish on RTY due to the higher high made on the daily chart.
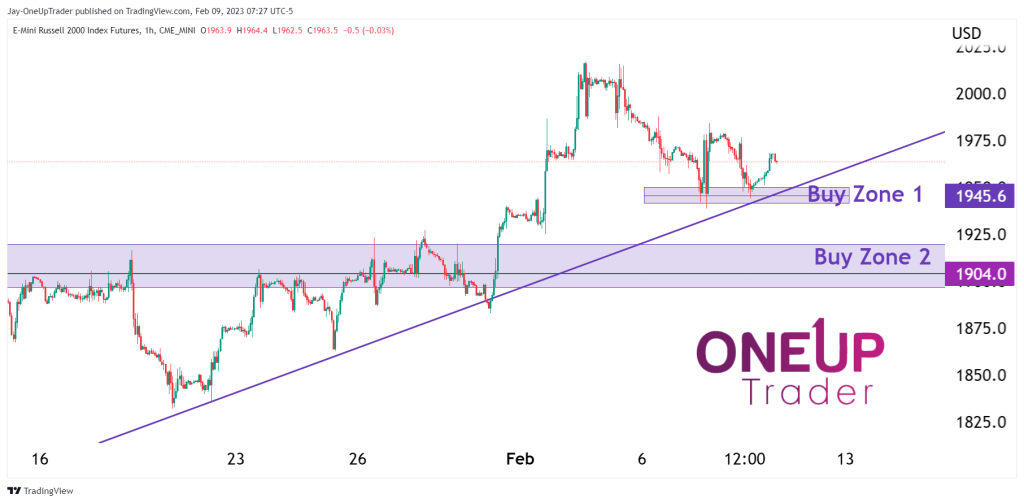
- Looking at the hourly time frame for possible entries.
- A very inspirational mini-movie about a Japanese day trading legend.
Analysis
In our technical report two weeks ago, we looked at two potential trades, a long and a short one. Traders who took the long trade have been rewarded as the target has been hit at the 0.382 level at $1,954.
The trend is bullish since we have a higher high, so the question is whether we have opportunities right now or if it’s better to sit on our hands.
Hourly time frame
The shorter-term time frames give me two potential areas to initiate new long positions. The first at $1,945.6 and the second at $1,904. There is a solid trend line that the price has been following since the start of the year, and if we do see a break below it, I would not immediately assume that the trend is going to reverse. In fact, I would suspect we move sideways for a while, consolidating before a further move to the upside occurs if fundamentals remain the same.
Inspirational mini-movie
The following short movie is one I recently came across and was very inspirational. It shows just how important it is to be focused when it comes to financial markets. Do not let emotions dictate your decision-making!