Current Trend and Price Action
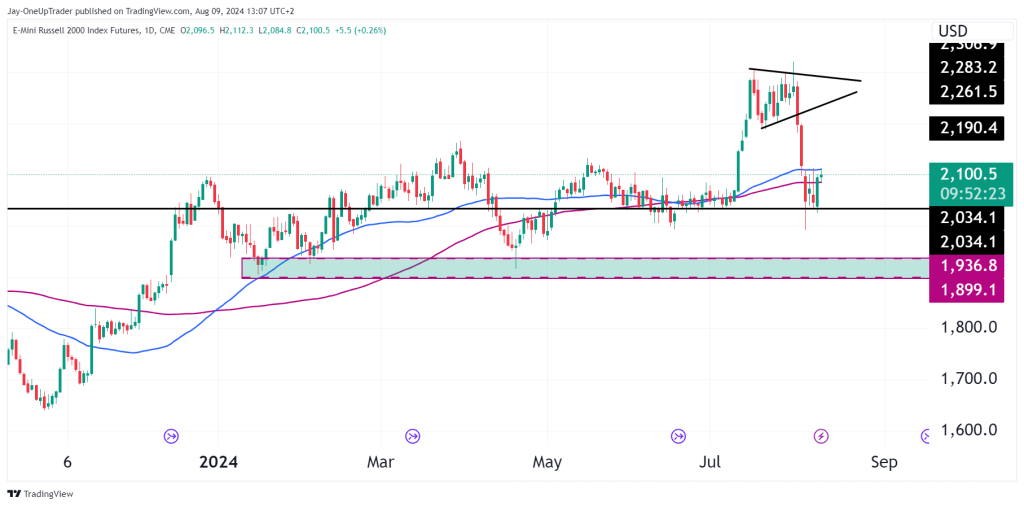
- Symmetrical Triangle Breakdown: RTY was consolidating within a symmetrical triangle pattern which had formed after the price was stuck sideways form 2024. However, instead of breaking upwards, the price broke downwards.
- Support Levels: The index found support around the 2,034 level, which coincides with a previous consolidation area from earlier in the year. This support level has been tested recently and appears to be holding for now.
- Reversal Candlestick: Following the breakdown, there was a significant drop, but the index has quickly rebounded, forming a bullish reversal candlestick. This suggests that the breakdown might have been a false one, or at least, that there’s strong buying interest at lower levels.
Moving Averages
The price is currently hovering near the 200-day moving average (around 2,100). The 50 MA is at the same price and is acting as additional support to the price for now.
Support and Resistance Zones
- Resistance at 2,190-2,200: The previous breakdown level around 2,190, which is also near the recent high, acts as a strong resistance. This zone needs to be cleared decisively for bulls to regain control.
- Support at 2,034 and Below: The support at 2,034 is critical. If the price fails to hold above this level, a retest of the 1,900-1,936 zone is likely, where stronger demand could potentially emerge.
Volume Considerations
- Volume during the breakdown was relatively significant, suggesting that the move was driven by considerable selling pressure. However, the swift rebound with relatively low volume could indicate that this was a short covering rally rather than a strong surge of new demand.
Probable Scenarios
Bullish Scenario:
- If the price manages to stay above the 200-day MA and clears the 2,190 resistance level, we could see a retest of the recent highs, potentially leading to a breakout above 2,261.5.
- A decisive close above the recent highs would invalidate the bearish breakdown and could signal a resumption of the primary uptrend, with targets near the 2,300-2,350 area.
Bearish Scenario:
- Failure to sustain above the 2,100-2,110 level and a break below 2,034 would likely confirm the bearish outlook, leading to a retest of the 1,900-1,936 support zone.
- A breakdown below 1,899 would open the door for a deeper correction towards the 1,800 level or lower, where the next significant support lies.
If you have any technical analysis or a great trade you took with an explanation of your process, please send it to us via our Instagram here or email [email protected] or [email protected]. The trader who sends the best analysis/trade that week will receive a 25% discount code to use on any Evaluation.