Weekly Chart Analysis:
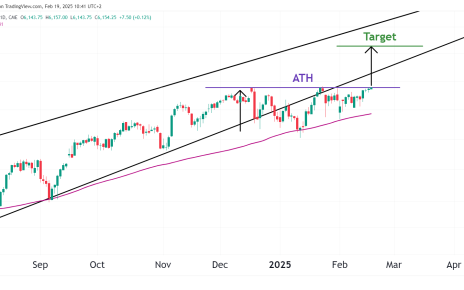
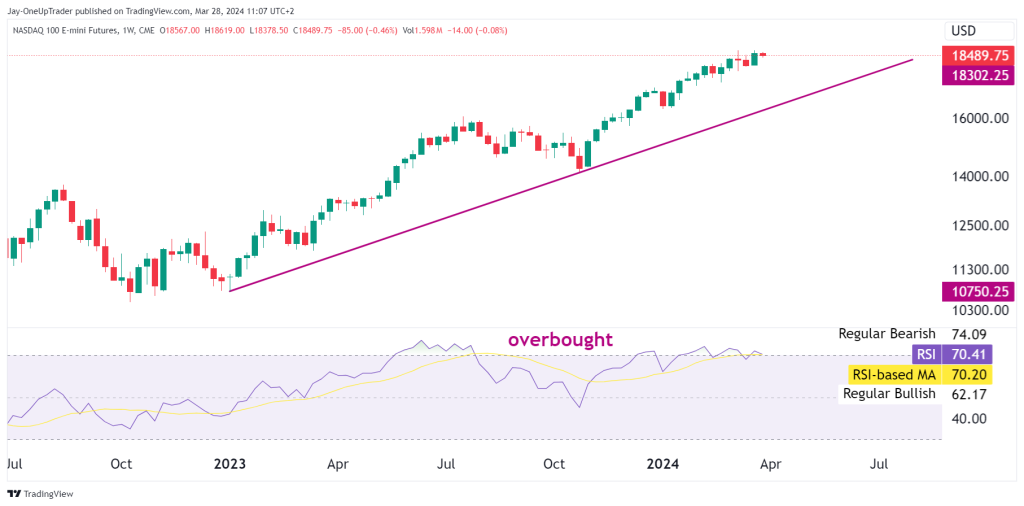
- The NASDAQ 100 E-mini Futures shows a strong uptrend, confirmed by higher highs and the price firmly above a rising trend line.
- The Relative Strength Index is nearing overbought territory, indicating strong buying pressure, but is something bulls must be cautious of.
Key Levels to Monitor:
- Immediate support is at the ascending trendline, which currently lies around the 17800 level. This could serve as a strategic entry point for a long position, with expectations of trend continuation.
- Overhead resistance may form near recent highs at approximately 18800.
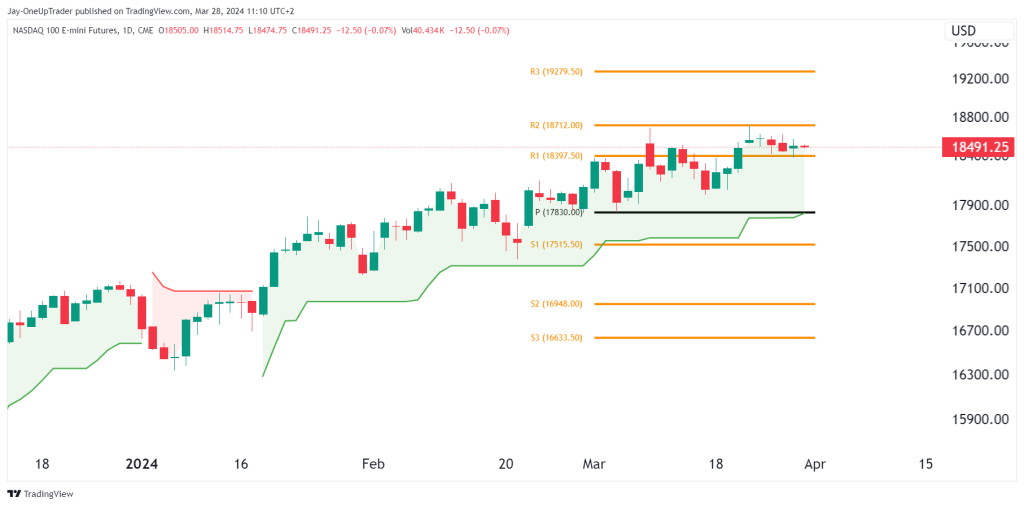
Daily Chart Analysis:
- Resistance levels R1 (18397.50), R2 (18712.00), and R3 (19279.50) mark potential profit-taking targets for long positions.
Trade Strategy:
- Long Entry: Look for potential entry points near the trendline support or the pivot point level, with the price remaining above these levels.
- Profit Targets: Set initial targets at R1, followed by R2 and R3 for extended gains.
- Stop-Loss Considerations: A stop-loss could be placed below the most recent swing low to manage risk, ensuring it’s not too tight to avoid market noise.
Before entering any trade, confirm it aligns with your risk tolerance and trading plan. Monitor the trade actively, adjusting stop-losses and targets as the market moves. Stay informed and be ready to act on new information that could influence market direction.