

- Analyzing the rising wedge, RSI, Fibonacci retracements, and candlesticks on the daily.
- Looking at why it’s likely we see Gold retrace from here ($1,880).
- How bulls can initiate longs if they are patient.
Quick Recap
Gold was trading at around $1,845 on January 5th from the last GC analysis. I stated the likelihood of a minor pullback from those levels toward the 0.5 Fib level, which is precisely what occurred. The Gold price bounced with power off that level and has rallied 3.1% since that retracement occurred. We can look at a few technicals from here to decide whether Gold Futures are overbought or if we can enter longs again at a pullback.
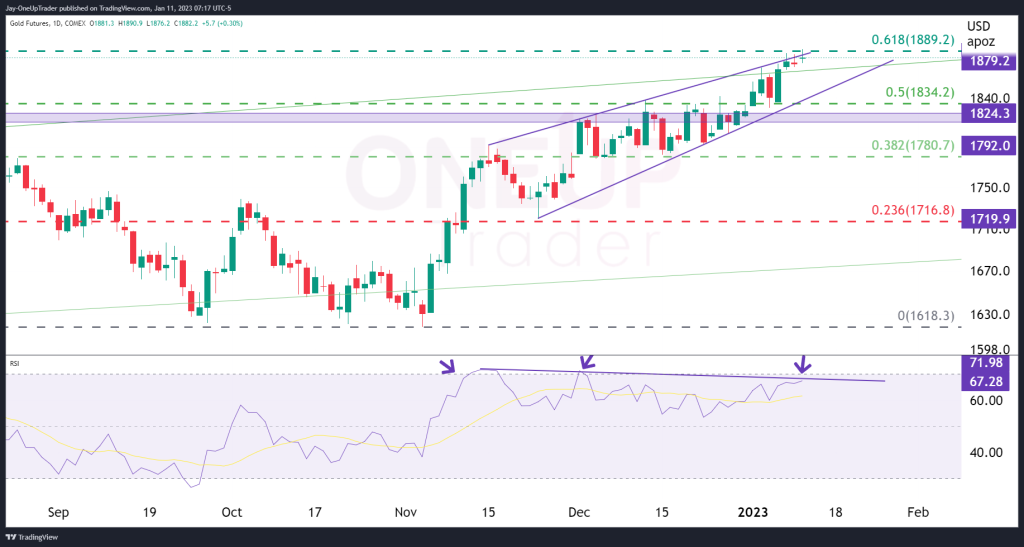
RISING WEDGE – There is a small rising wedge pattern on the daily chart, and Gold is currently trading at the upper end of it. If we see a significant close above this level that you can see on the chart below, then it’s a relatively smooth path toward the 0.786 Fib level; however, with the recent rally that has occurred, it’s a stretch right now, in my opinion.
RSI – The relative strength index still looks bullish on the daily chart, but there are small indications of possible bearish divergence building up. If we take the current rally into account only, there was a high made into the overbought zone back in November 2021, the second peak also reached the overbought zone in December, and the current RSI reading has not broken into the overbought zone. As I said, there is no bearish divergence yet, but it could be the start and should be something to keep an eye on.
Fibonacci Levels – The Fib levels have been a great way to set targets and entries as GC skyrockets. As price approaches the 0.618 level, though, it appears the small bull run is likely to pause for a while. The 0.618 level will likely act as sufficient resistance, and if the daily candle closes bearish, we will probably see the start of a new retracement. Will the pullback go back to the 0.5 level at $1,834.2 is something we will need to wait to find out.
Candle Stick Patterns – Recent daily candlestick patterns show indecision in the market with small candles with wicks to the upside. This shows profit-taking on the bulls’ side, which is why it’s critical to monitor today’s daily close.
Conclusion
GC has been on a tear recently. There is no sign the bullish momentum is coming to an end, however, it does appear overbought in the short run. There is a likely chance of a pullback potentially back to the 0.50 level or bottom side of the rising wedge which could be the place to initiate new long entries. The RSI remains bullish with very slight signs of bearish divergence.

