


Introduction
The Nasdaq 100 Futures (NQ) have rebounded on Monday, showing the first sign of stabilization after the sell-off began in late October. Price action now sits right on top of the same support zone highlighted in the November 4th analysis, where the previous all-time high, 50-day moving average, and pivot structure converge.
While momentum has cooled, the longer-term uptrend remains intact, but the market is now sitting at an important level that will determine whether this pullback resolves into a renewed uptrend or breaks into a deeper correction.
Nasdaq Technical Overview
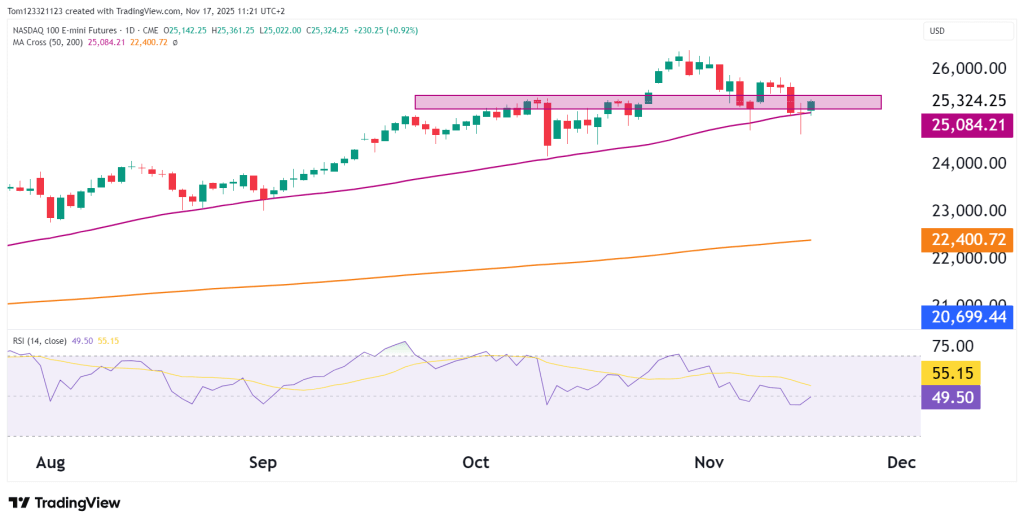
Monday’s candle shows buyers stepping back in right above the 50-day moving average. There is also a morning star candlestick pattern forming, and the strength is multiplied because it’s bouncing off the 50-day MA and the support zone, which formed from the previous all-time high.
This zone includes:
- 25,520 — former ATH and major pivot from October
- 25,300–25,200 — October consolidation top
- 25,084 — rising 50-day MA
As long as the market holds above these levels, the medium-term trend remains bullish.
However, the recent inability to reclaim 26,000 and the lower highs forming over the last two weeks highlight weakening momentum — even as structural support still holds.
If NQ breaks below 25,100:
A deeper pullback becomes likely, with open space toward:
- 24,760 — secondary support
- 24,647 — S1 pivot from the prior analysis
If buyers regain 25,900–26,000:
Momentum can quickly shift back upward, opening the door for:
- 26,882 → next breakout trigger
- 27,761 → extended upside target
For now, the index is consolidating, but the long-term trend remains bullish. It is not trending, however, the bulls are in defence mode.
🎯 Ready To Get Funded?
Start your 7-day free $100K evaluation with OneUp Trader and take the first step toward becoming a funded trader.
Start Evaluation Now →Key Technical Levels
| Type | Level | Description |
|---|---|---|
| Resistance 1 | 25,900–26,000 | Immediate resistance |
| Resistance 2 | 26,882 | R1 pivot |
| Resistance 3 | 27,761 | R2 pivot |
| Support 1 | 25,520 | Former ATH |
| Support 2 | 25,084 | 50-day MA |
| Support 3 | 24,647 | S1 pivot |
Nasdaq Probability Table (Next 2–3 Weeks)
| Scenario | Estimated Probability | Notes |
|---|---|---|
| Consolidation between 25,200–26,000 | 55% | Still the dominant structure; support holding cleanly. |
| Breakout above 26,900 → target 27,700+ | 30% | Needs strong momentum return and macro tailwinds. |
| Breakdown toward 24,700–24,500 | 15% | Only if 25,080–25,300 fails decisively. |
Nasdaq Fundamentals
Short-term pressure on tech is being driven by a shift toward value and defensive sectors, uneven earnings from semiconductor and cloud companies, and growing uncertainty around year-end liquidity.
Still, the broader backdrop remains supportive. The Federal Reserve is expected to keep rates steady, U.S. economic data continues to show resilience, and the tech sector is leading earnings growth compared to the rest of the market.
In this context, the current consolidation looks more like healthy positioning than a true risk-off move.
Summary
Nasdaq 100 Futures are holding steady at a key support zone, right in line with the projected pause from the November 4th analysis. The broader uptrend is still intact above the 50-day moving average, but the pace has clearly slowed — this stage is more about holding ground than pushing higher.
A move back above 26,000 could reignite momentum, while a close below 25,080 would put 24,700 in play as the next support level.
For now, NQ remains in a controlled consolidation phase, with a neutral-to-bullish outlook in the medium term.
This analysis is for educational and informational purposes only and does not constitute trading advice or a recommendation to buy or sell any futures contracts. Futures trading involves significant risk and may not be suitable for all investors. Always conduct your own research and consult with a licensed financial professional before making trading decisions.
