


Introduction
Light crude oil futures remain in recovery mode after rebounding sharply from long-term support in the mid-$50s. Price has reclaimed the $60 handle and is now consolidating just below the 200-day moving average.
This marks a shift in behavior from persistent selling to selective buying. The market is no longer in a breakdown phase, but it has not yet proven it can sustain higher prices. Instead of accelerating lower, crude is probing higher levels and forcing sellers to defend resistance.
Crude oil is moving from defense to evaluation.
Market Summary
Primary trend: Corrective on a longer-term basis
Current market perspective: Range repair following a base-building phase
Key support (line in the sand): $55–56
Bias-defining level: $62–63
Risk: Failure to hold above reclaimed range support
Market Structure & Trend
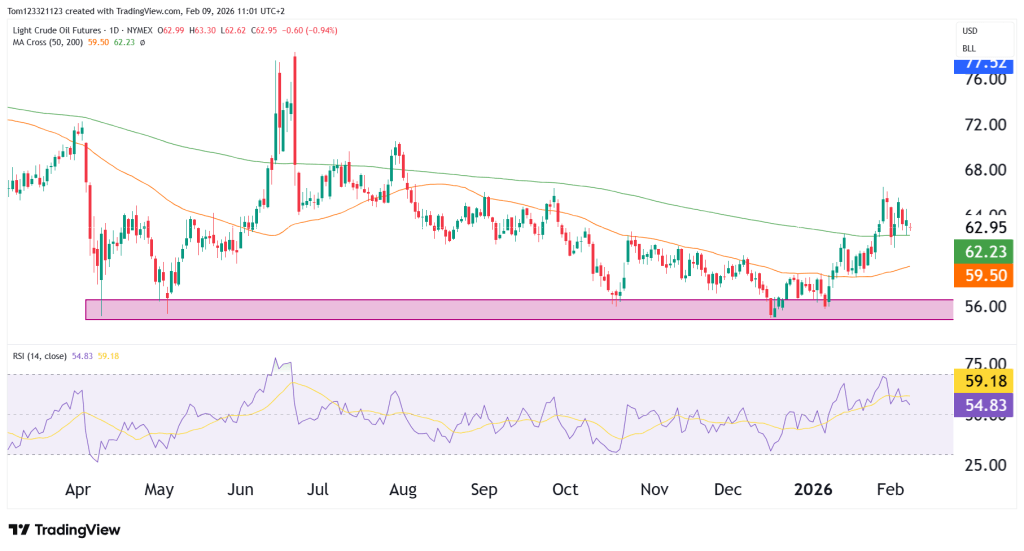
Daily Chart
On the daily chart, crude oil continues to respect the $55–56 support zone.
Key observations:
- Price rebounded cleanly from long-term support
- The 50-day moving average has turned higher
- Pullbacks remain shallow and corrective
Price is still struggling beneath the 200-day moving average near $62–63, which remains the main obstacle to further upside. However, price is leaning into this level rather than being rejected aggressively.
This suggests sellers are no longer in full control, even if buyers have not fully taken over.
Weekly Chart
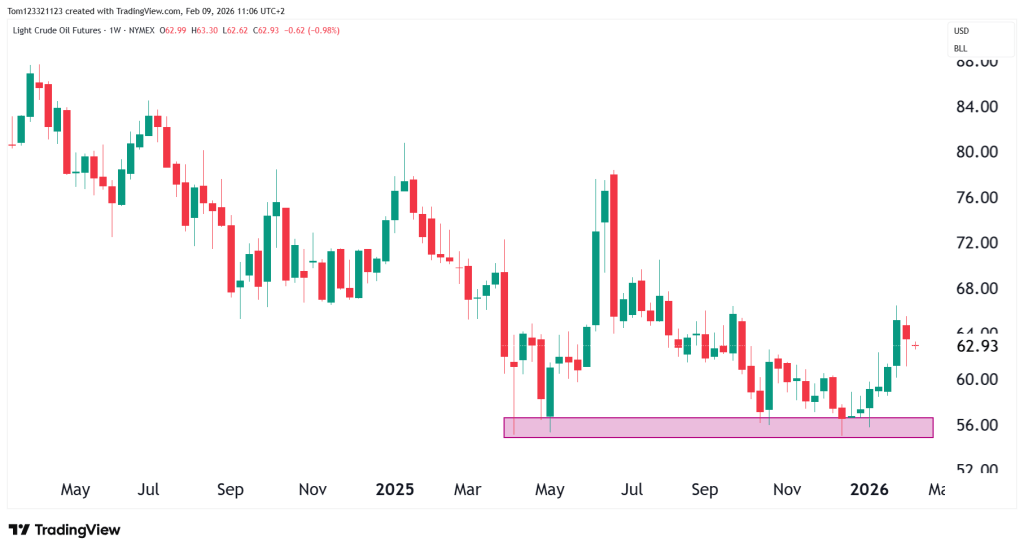
On the weekly chart, crude oil appears to be building a base after a prolonged corrective phase. Price has repeatedly held the $55–56 area, confirming it as a meaningful long-term support zone rather than a temporary bounce level.
While the broader weekly trend is still neutral-to-down, momentum has stabilized, and downside follow-through has diminished. This supports the idea that the worst of the selling pressure is likely behind us, even if a sustained bull trend has not yet begun.
Key Technical Levels
Line in the Sand
$55–56:
This remains the most important level on the chart. A sustained break below this zone would negate the base and reopen downside risk.
Levels That Define the Bias
$62–63:
The 200-day moving average and former resistance. Acceptance above this level would mark a meaningful improvement in trend structure and strengthen the bullish case.
$59–60:
Former resistance turned support. Holding this area keeps the recovery intact.
Reference and Extension Levels
$67–68:
Top of the prior trading range and the next area where sellers are likely to engage.
$72+:
A bullish extension zone if crude is able to transition from repair into a sustained uptrend.
Looking Forward: Scenarios
Bullish Repair (40%)
Acceptance above $62–63 leads to a grind higher toward $67–68 as structure continues to improve.
Sideways Consolidation (35%)
Price holds between $59 and $63 as the market digests gains and waits for clearer macro direction.
Bearish Failure (25%)
A rejection at resistance followed by a loss of $59 increases the risk of a return toward $55.
Final Takeaway
Above $63, buyers begin to take control. Below it, crude remains in a repair-driven range.
The market has successfully defended long-term support and shifted away from aggressive selling. That alone is an important change. However, until price can accept above the 200-day moving average, rallies should still be viewed as part of a broader rebuilding process rather than the start of a new bull cycle.
This analysis is for educational and informational purposes only and does not constitute trading advice or a recommendation to buy or sell any futures contracts. Futures trading involves significant risk and may not be suitable for all investors. Always conduct your own research and consult with a licensed financial professional before making trading decisions.

