


Introduction
Asset: Bitcoin (BTC/USD)
Timeframe: Daily
Date: April 10, 2025
Current Price: $82,000
Focus: Is the consolidation phase ending? Are new highs next?
Market Context
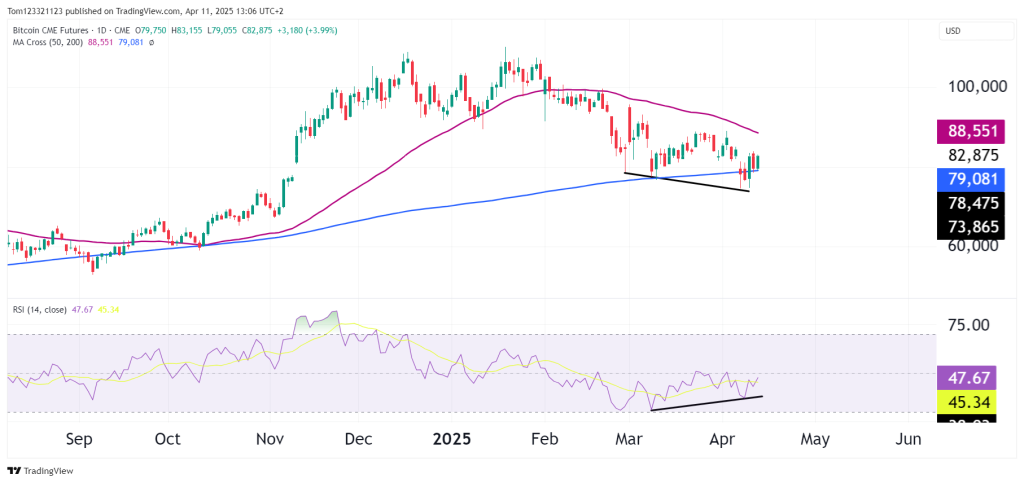
Bitcoin is showing strong signs that the multi-week correction may be behind us. After cooling off from an all-time high of $110,000, BTC entered a healthy consolidation phase — one that now appears to be maturing into a breakout attempt.
Technical Breakdown
Price Action
- BTC has reclaimed $80,000 and is now stabilizing.
- Bullish flag or ascending triangle forming — tight range, higher lows, and volume compression.
- A break above $88K could trigger the next leg toward $90K+.
- RSI bullish divergence
Key Levels to Watch
| Price Level | Type | Notes |
|---|---|---|
| $88,000 | Resistance | Short term resistance |
| $77,000-$80,000 | Support | Reclaimed key psychological level |
| $100,000 | Target | Round number, extension projection |
Summary Dashboard
| Signal Type | Status |
|---|---|
| Trend | 📈 Bullish above $78K |
| RSI / Momentum | ↗ Reset & rising |
| Chart Structure | ⏳ Coiling for breakout |
| Risk Zone | 🔴 Break of $76K = structural risk |
| Bias | ✅ Accumulate dips, breakout ready |
Ending Off
As long as $78K–80K holds, BTC looks poised to make an aggressive push toward $90K and beyond.
