


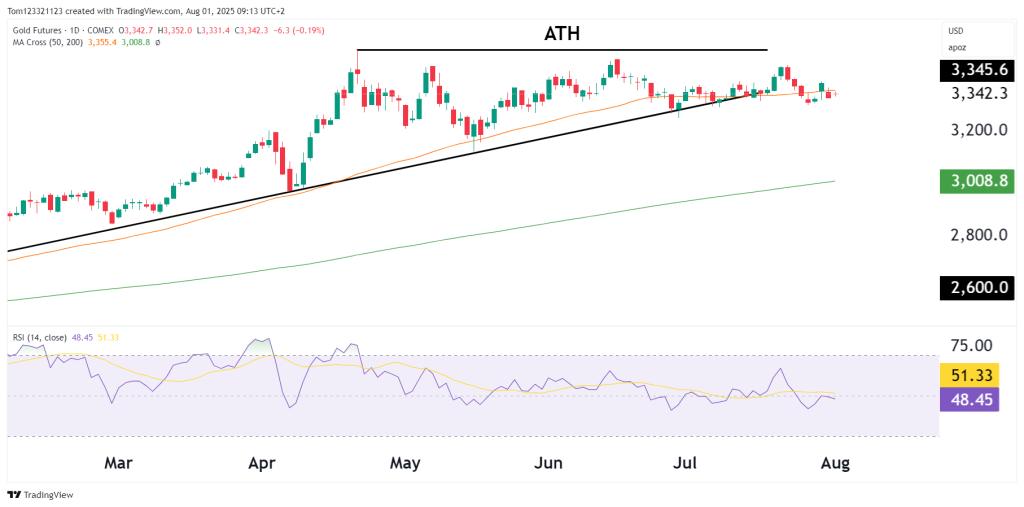
Current Price: 3,342.30
Change: -6.30 (-0.19%)
ATH: ~3,510
50-day MA: 3,355.4
200-day MA: 3,008.8
RSI (14): 48.45 (Neutral to Weakening)
Gold Trend This Year
Technical Analysis
- Price is consolidating just below the ATH, and the ascending triangle has not led to any bullish break.
- RSI has broken below 50, now sitting at 48.45 — not oversold, but shows fading momentum.
- The 50-day MA has flattened, and the price is hovering right at it.
- Trendline from January remains intact but is increasingly being tested. It’s the last support before a deeper pullback.
- The 200-day MA remains far below, indicating that the long-term uptrend is still structurally intact.
Technical Context
| Indicator / Feature | Current Reading | Implication |
|---|---|---|
| Price vs ATH | ~170 pts below ATH | Consolidation under key resistance |
| 50-day MA | Price sitting on it | Neutral support test |
| Trendline (YTD) | Still holding | Break would shift bias bearish |
| RSI (14) | 48.45 | Weak momentum |
| Volatility | Low | Coiling for next move |
Is the Gold Rally Over?
Arguments That the Rally May Be Over:
- Momentum indicators are no longer confirming highs.
- Price is coiling below resistance for an extended time — risk of bull fatigue.
- The chart shows lower highs since the ATH — signs of distribution.
- Rising real yields and improving dollar strength (see DXY) could act as macro headwinds.
Arguments That It’s Just a Pause:
- Long-term trend is clearly intact (above both 50 and 200 MAs).
- No major breakdown yet — price is compressing, not reversing.
- Support trendline from Q1 is still holding.
- Possible bull flag/pennant forming — a common pattern before continuation.
Probability Table
| Scenario | Estimated Probability | Notes |
|---|---|---|
| Continuation to retest ATH (3,510) | 40% | Needs breakout above 3,360 with volume |
| Extended consolidation 3,300–3,450 | 45% | Most likely near-term outcome |
| Break below trendline toward 3,200–3,150 | 15% | Only if macro headwinds accelerate |
Trade Strategy Considerations
Bullish Case:
- Look for a breakout above 3,360–3,370 to add or initiate.
- Set stop below 3,300 (trendline support) for defined risk.
- Watch DXY and yields — if they soften, gold can catch a bid again.
Bearish Case:
- A break below the trendline (3,300) would invite momentum shorts.
- First target would be 3,200, then possibly 3,150 (prior breakout base).
- A rising dollar and hawkish Fed could accelerate this.
Ending Off
Gold’s rally is not over, but it is in a consolidation period. Price is trapped in a coiling range just below the highs, and momentum has clearly deteriorated. This is a make-or-break zone.
So long as the uptrend line and 50-day MA hold, bulls remain in control on the broader timeframe. But a breakdown from here will confirm that gold’s rally has moved from stalling into unwinding.

