

Introduction
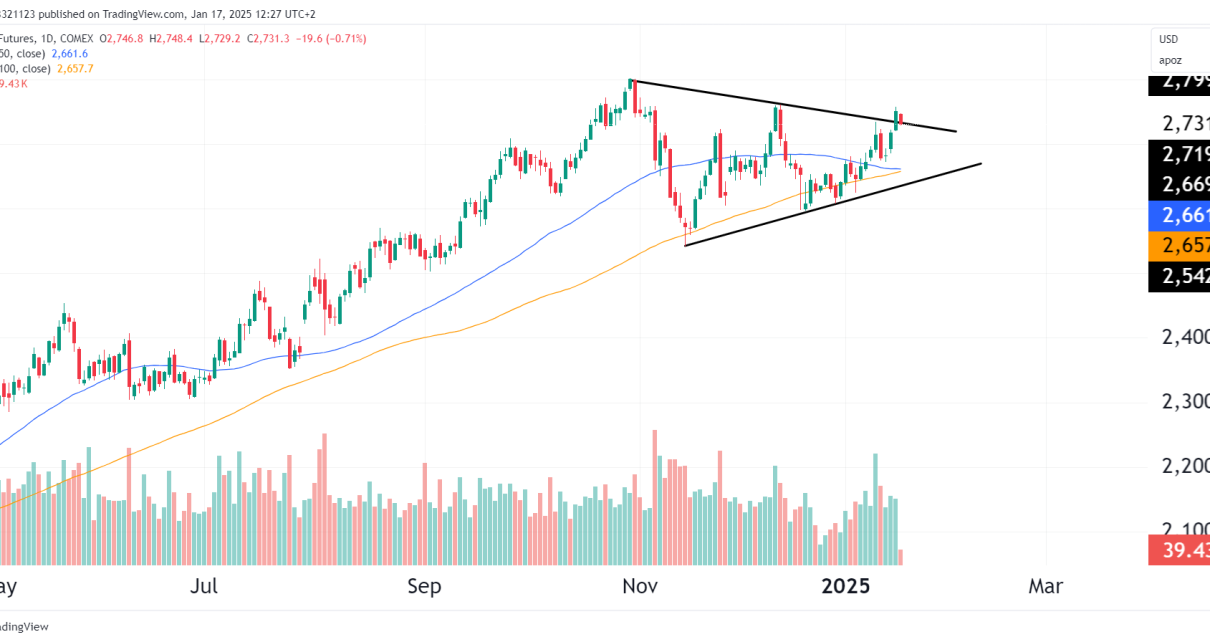
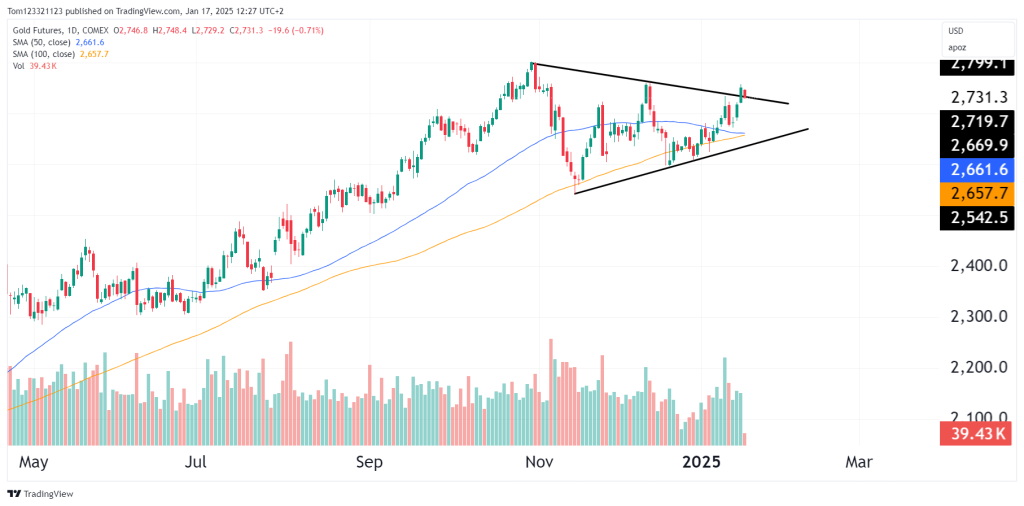
Gold futures (GC) are trading at $2,730.7, consolidating near the upper boundary of a symmetrical triangle pattern. Despite briefly testing the breakout zone, the move lacks strong follow-through, leaving the potential for a retracement back toward the triangle’s support line. Both bullish and bearish scenarios remain in play, and traders should monitor critical levels closely.
Technical analysis overview
Symmetrical Triangle Pattern:
- Gold remains within a well-defined symmetrical triangle that has been forming since October 2024. The price is currently testing the upper boundary, but a decisive breakout has yet to occur.
Support and Resistance Levels
Resistance Levels:
- $2,750: The upper boundary of the triangle, currently acting as resistance. A close above this level would signal a breakout and open the path to higher targets.
- $2,800: A key psychological level and the first upside target following a breakout.
- $2,850 – $2,900: A measured move from the triangle’s height projects this range as the ultimate target.
Support Levels:
- $2,700: Immediate support, aligning with recent consolidation and acting as the lower threshold of the current trading range.
- $2,661 (50-day SMA): A key dynamic support level within the triangle.
- $2,657 (100-day SMA): A longer-term support level coinciding with the lower boundary of the triangle.
Scenarios to Watch
Bullish Case:
- A daily close above $2,750 would confirm a breakout from the symmetrical triangle and target the $2,800 – $2,850 range in the near term. Volume and follow-through will be critical for confirmation.
Bearish Case:
- A rejection at the upper boundary of the triangle and a move below $2,700 would likely lead to a retest of the lower boundary near $2,660.
- A breakdown below the lower boundary would invalidate the pattern and expose downside targets at $2,600 – $2,550.
Trade Ideas
Bullish Setup:
- Entry: Long positions on a confirmed breakout above $2,750.
- Targets:
- First target: $2,800.
- Second target: $2,850.
- Stop-Loss: Below $2,720 to manage risk.
Bearish Setup:
- Entry: Short positions on a rejection near $2,750, targeting a retracement.
- Targets:
- First target: $2,700.
- Second target: $2,660 (50-day SMA).
- Stop-Loss: Above $2,775 to minimize risk.

