Introduction
YM is flat year-to-date but is only 10% away from all-time highs. With most equity indices, YM’s low was back in October of 2022, which is exactly one year ago. The price rallied 25% from there before retracing 7% to current price levels.
Weekly Chart
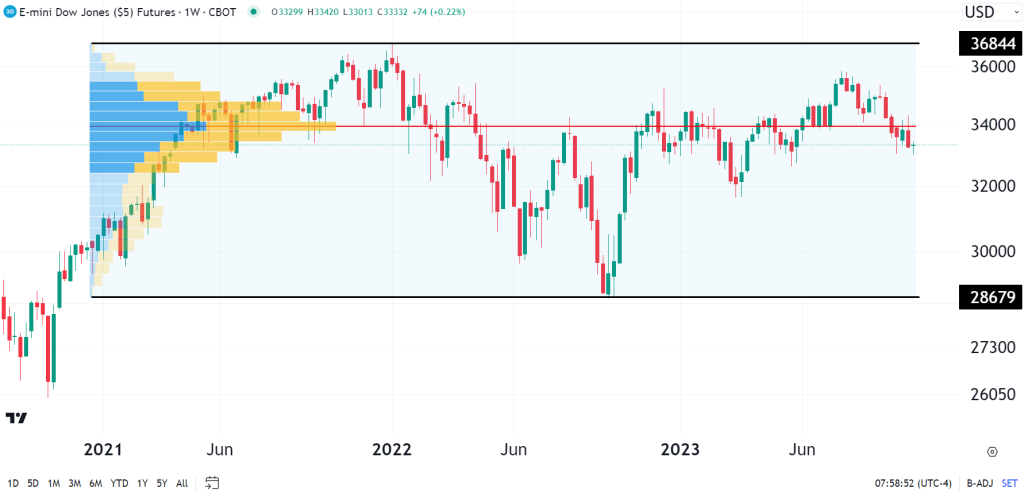
YM has been between $28,679 and $36844 since the start of 2021 after the post-COVID equity surge. Applying the volume profile indicator to this range gives us a point of control at around $34000. This is the price where most trading occurred. The current price of YM is $33,400 as volatility is at a low due to high volume nodes.
Daily Chart
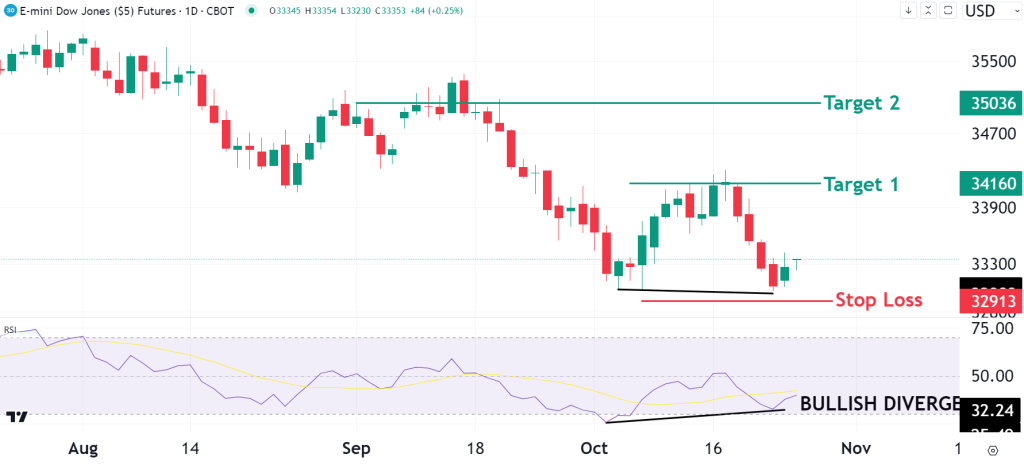
There is an interesting setup on the daily chart for the Dow Jones Futures that could lead to a profitable long trade. At the moment, a small double bottom has formed, and the RSI has confirmed bullish divergence. We have a solid place for our stop loss just below the lows. Target one can be set at $34,160, and target two at $35,036. There might be some consolidating at current levels, however, and it may be a patient wait for those levels to get hit. We also need to keep in mind the worrying issues going on around the globe at the moment, which could lead to devastation in the market. We do not need to fear that, but we should monitor events closely to make sure we are not stuck in any positions that we don’t want to be, especially overnight.