


Introduction
Gold continues to trade within a strong uptrend, with price consolidating just below recent all-time highs (ATH) after another bullish impulse. Price is also breaking above the ascending triangle, but has pulled back to test the horizontal support level. Despite this short-term volatility near the highs, the broader technical structure remains constructive, with buyers continuing to defend pullbacks.
Technical Structure
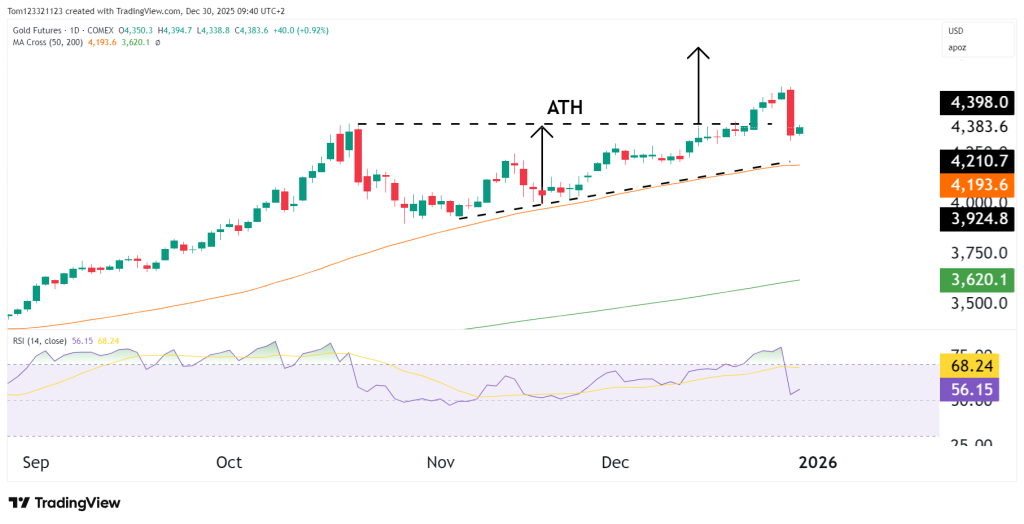
On the daily chart, gold remains above its rising 50-day moving average, which continues to act as dynamic support. The market has printed a series of higher highs and higher lows, confirming that the dominant trend remains bullish. Recent pullbacks have been shallow and corrective.
The rising trendline from the November lows remains intact, and price is currently compressing between that trendline and overhead ATH resistance — a structure often seen ahead of a potential continuation move.
Key Levels to Watch
- Resistance
- 4,380 – 4,400: All-time high zone and current ceiling
- Near-term Support
- 4,200 – 4,210: Rising trendline and prior breakout area
- 4,190 – 4,170: 50-day moving average
- Major Support
- 4,000 – 3,950: Psychological level and prior consolidation
- 3,620: 200-day moving average (longer-term trend support)
Momentum (RSI)
RSI remains bullish but not extreme, holding comfortably above the 50 level. While momentum has cooled slightly after recent highs, there are no clear bearish divergences present. This behavior is consistent with a trend continuation environment, where momentum resets through consolidation rather than sharp reversals.
Technical Scenarios
- Bullish continuation:
A sustained hold above the rising trendline and 50-DMA keeps the path open for another attempt at a clean breakout above ATH, potentially leading to renewed price discovery. - Neutral / consolidation:
Price may continue to rotate between 4,200 and ATH, allowing moving averages to catch up and relieve overextension. - Deeper pullback:
A loss of the 50-DMA could trigger a move toward the 4,000 region, though this would still be considered corrective unless the broader structure breaks.
Estimated Probability Scenarios
| Scenario | Description | Estimated Probability |
|---|---|---|
| Bullish continuation | Break above ATH following consolidation | 45% |
| Range / consolidation | Sideways trade between 4,200–4,400 | 35% |
| Deeper pullback | Move toward 4,000 support | 20% |
Fundamental Picture
From a fundamental perspective, gold continues to be influenced by U.S. monetary policy expectations, real yields, and the U.S. dollar. Any signs of cooling inflation, softer economic data, or a more accommodative Fed outlook tend to support gold prices, while rising real yields can act as a headwind. Ongoing geopolitical uncertainty and central bank gold purchases remain longer-term supportive factors, helping to underpin demand during pullbacks.
Upcoming U.S. inflation data, Federal Reserve communications, and Treasury yield movements are likely to be key drivers of near-term volatility.
This analysis is for educational and informational purposes only and does not constitute trading advice or a recommendation to buy or sell any futures contracts. Futures trading involves significant risk and may not be suitable for all investors. Always conduct your own research and consult with a licensed financial professional before making trading decisions.


