

Market Snapshot
| Metric | Value |
|---|---|
| Current Price at time of writing | 1.16395 |
| 50-Day MA | 1.16444 |
| 200-Day MA | 1.09894 |
| Key Resistance | 1.1700 – 1.1800 |
| Key Support | 1.15625 (range floor), 1.14250 (major swing low) |
Technical Overview
Weekly Chart
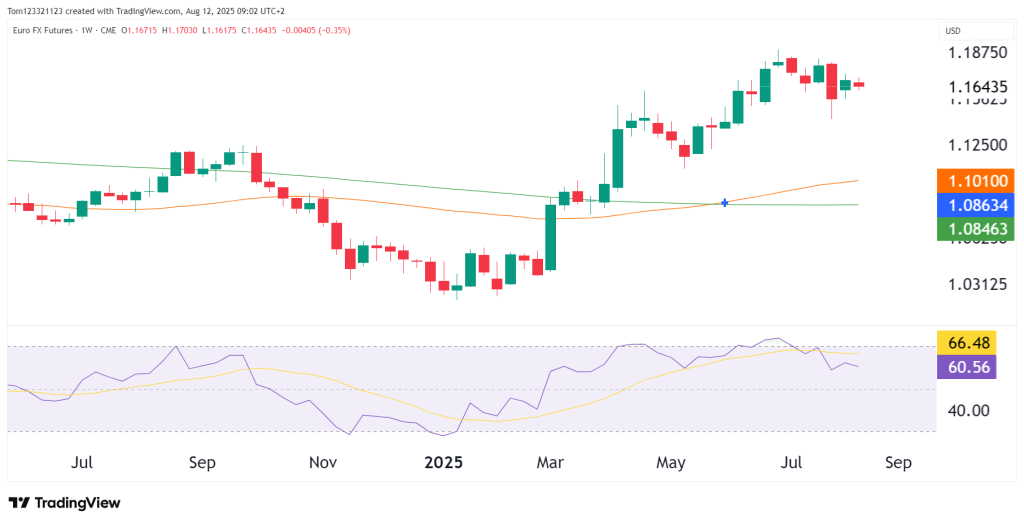
The weekly chart is a good way to show the strength of the long-term trend of any asset. The Dollar has dropped 12.5% since January, and since the Euro/Dollar is priced against each other, if the Dollar rallies, then the Euro falls and vice versa. In this way, we can see that the rally in the Euro since January is really only because of the fall in the dollar’s value.
The Dollar rallied right after Donald Trump was elected president, as investors anticipated a return to lower U.S. interest rates and higher corporate profits. Instead, a trade war heated up, and the US got involved in terrible conflicts in the Middle East. This is what lead to the slump in the Dollars value and the Euro has rallied because of it.
Now, however, as the conflicts cool, the Dollar is picking itself up again, and so the Euro is falling in value. Let’s see what the technicals tell us.
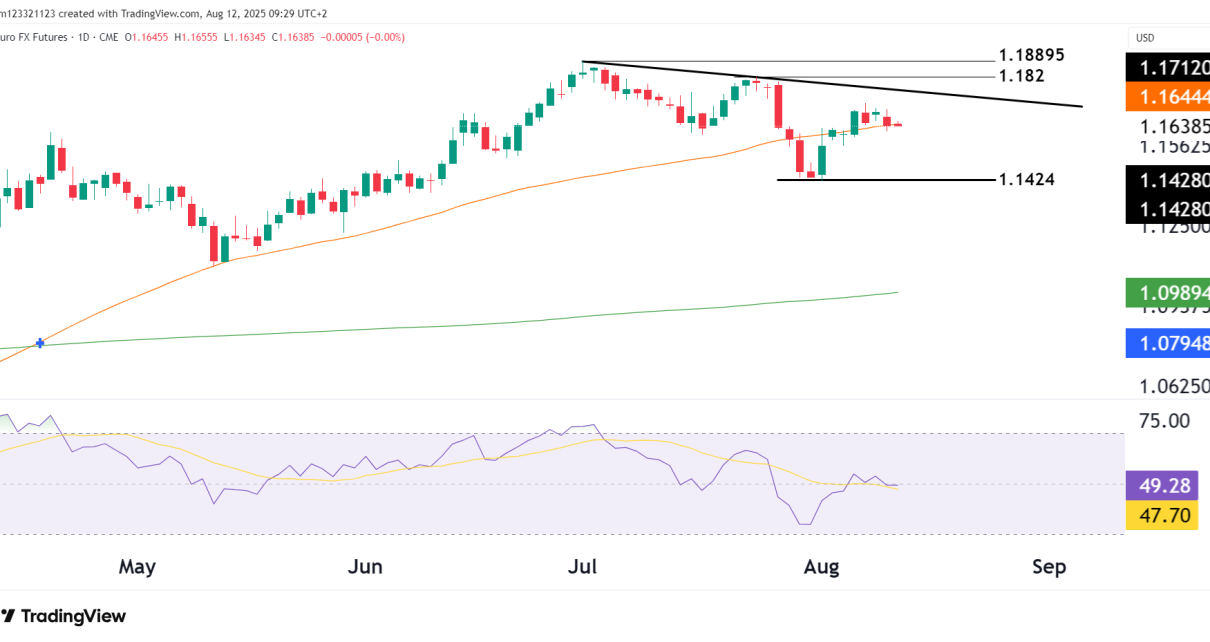
Daily Chart
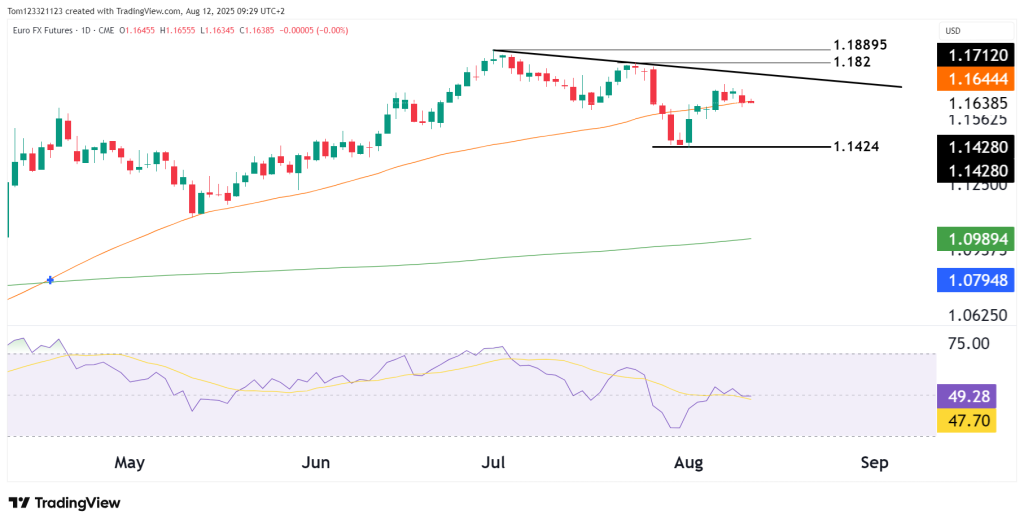
The Euro FX Futures (6E) are in a consolidation phase of lower highs and lower lows, similar to a flag formation. The price is currently trading on the 50-day simple moving average, and bulls will attempt to keep the market above that. The key level from there on the downside is 1.1424, the recent low made at the end of July. If the price starts to ‘roll over’ a bit, that would be the most immediate target.
A rally, however, would mean the first resistance would be at 1.182, and breaking above that would likely require some sort of fundamental catalyst on the side of the Dollar.
Momentum & Indicators
- RSI at 49.36 is neutral, coming from overbought.
- Short-term momentum is fading after the bounce — bulls need a breakout above 1.1650 to regain control.
Key Technical Levels
| Level | Type | Comment |
|---|---|---|
| 1.16430 | Resistance | Confluence of trendline & 50MA |
| 1.15625 | Support | Short-term range floor |
| 1.1424 | Major Support | Recent swing low, breakdown risk if lost |
| 1.09894 | 200MA | Long-term bull/bear pivot |
| 1.12500 | Psychological | Below this, momentum turns sharply bearish |
Probability Table
| Scenario | Estimated Probability | Details |
|---|---|---|
| Breakout above 1.1650 toward 1.1750–1.1800 | 40% | Requires decisive close above 1.82 with follow-through buying. |
| Range-bound between 1.15625–1.1650 | 35% | Likely if USD remains steady and no major catalyst emerges. |
| Breakdown below 1.15625 toward 1.14250 | 25% | Bears would be taking over once more. |
Trade Setups
Bullish Breakout Play
- Entry: Close above 1.1650
- Target 1: 1.1750
- Target 2: 1.1800
- Stop: Below 1.1600
Bearish Breakdown Play
- Entry: Close below 1.1560
- Target 1: 1.1500
- Target 2: 1.1430
- Stop: Above 1.1600