


Introduction
Technicals on the Euro have once again shown that the range the price has been stuck in is a very difficult one to break. 6E futures have painted 16 red sessions in the past 18 as the Dollar staged a comeback. Some investment banks are becoming bearish on the Euro as Donald Trump leads the polls for the presidential nomination in the United States. The technicals are a difficult one to read at the moment but we can see if any opportunities are presenting themselves.
Technical Analysis
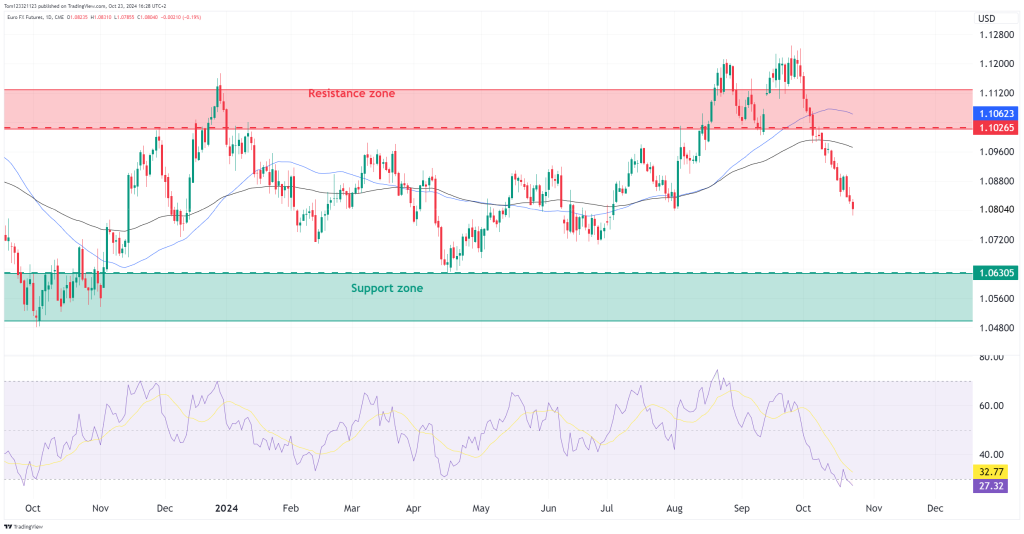
Resistance Zone (1.10623 – 1.11200):
- The price has been rejected multiple times in the marked red resistance zone above 1.10265 even after an attempted break above a few weeks back.
Support Zone (1.06305 – 1.07000):
- The price is heading towards the green support zone. This level has held firm in the past and may offer buying opportunities if price reaches this area again.
RSI Analysis (27.25):
- The RSI is currently deep in the oversold territory (below 30), indicating the potential for a bounce as the market is in an extremely oversold condition.
- This oversold RSI reading, combined with the proximity to the support zone, could signal an upcoming reversal or consolidation.
Trade Setups
Bullish Setup
- Entry: Look for a long position if the price reaches the support zone near 1.06305, especially if the RSI remains oversold or shows a bullish divergence (higher low in RSI while price makes a lower low).
- Confirmation: A bullish candlestick pattern like a hammer or a bullish engulfing pattern near the support zone would increase the probability of a successful trade.
- Stop-Loss: Place a stop below the support zone at around 1.048 to manage risk.
- Take-Profit: Target the first resistance at around 1.10265, potentially scaling out at interim levels like 1.0800 for safety.
Bearish Continuation Setup
- Entry: If the price breaks below the support zone at 1.06305 on strong volume, consider a short position. This break could signal further downside momentum, especially as the RSI shows prolonged bearishness.
- Confirmation: Look for a retest of the broken support as resistance for entry if there’s a confirmed breakdown.
- Stop-Loss: Set a stop above the previous support zone at around 1.0700.
- Take-Profit: Targets would be around 1.0480, which is a historical low, or trail the stop if the trend continues downward.
3. Reversal Setup at Resistance (Short-term Play):
- Entry: If the price manages to bounce from the support and heads towards the 1.10265 – 1.10623 resistance zone, a short position could be considered if there’s rejection or bearish patterns at this zone.
- Stop-Loss: Set a stop just above the resistance at 1.11200.
- Take-Profit: Scale out of the position as the price approaches the 50-day moving average (~1.0880) or lower support levels.
Sentiment and Overall Outlook:
- Short-term (1-2 weeks): Bearish. The momentum is down, and the price is approaching support. Look for a reversal around the support zone for a bullish opportunity. However, remain cautious of further downside if support fails.
- Medium-term (1-2 months): Neutral to bearish. The RSI indicates oversold conditions, but the overall trend remains under pressure, especially if moving averages continue downward.
- Long-term (3-6 months): Potentially bullish if the price holds the support zone and builds a base. A rally towards the resistance could be likely if this zone holds strong.
