


Introduction
The Russell 2000 continues to grind higher along with other US equity markets, recovering strongly from its late-November selloff and pushing back toward recent highs. Unlike the large-cap indices that have spent much of the past year in clear uptrends, small caps have been more uneven, moving through longer periods of consolidation and volatility.
The recent advance in RTY doesn’t look like a big breakout, but it does show improving structure and growing participation beneath the surface. Price is holding above key trend levels, pullbacks are being bought, and the index is no longer lagging behind. This is less about a sudden surge and more about steady repair.
Summary
Primary trend: Bullish
Current market perspective: Consolidation near highs
Key support (line in the sand): 2,500–2,520
Bias-defining level: 2,650–2,700
Risk to the thesis: Sustained acceptance back below the 50-day moving average
Why RTY Looks Different Than Large Caps
Small caps often lead early-cycle expansions and lag late-cycle rallies. Over the past year, RTY has spent more time digesting gains while the S&P 500 and Nasdaq pushed to repeated highs.
RTY has stopped making lower lows, staying above the 50 and 200 moving averages, and started responding constructively to dips. That shift suggests improving confidence in domestic growth expectations, easing financial conditions, or at least a reduction in downside fear. It’s not confirmation of a new leadership phase yet, but it is a meaningful improvement from where small caps were just a few months ago.
Market Structure & Trend
Daily Chart

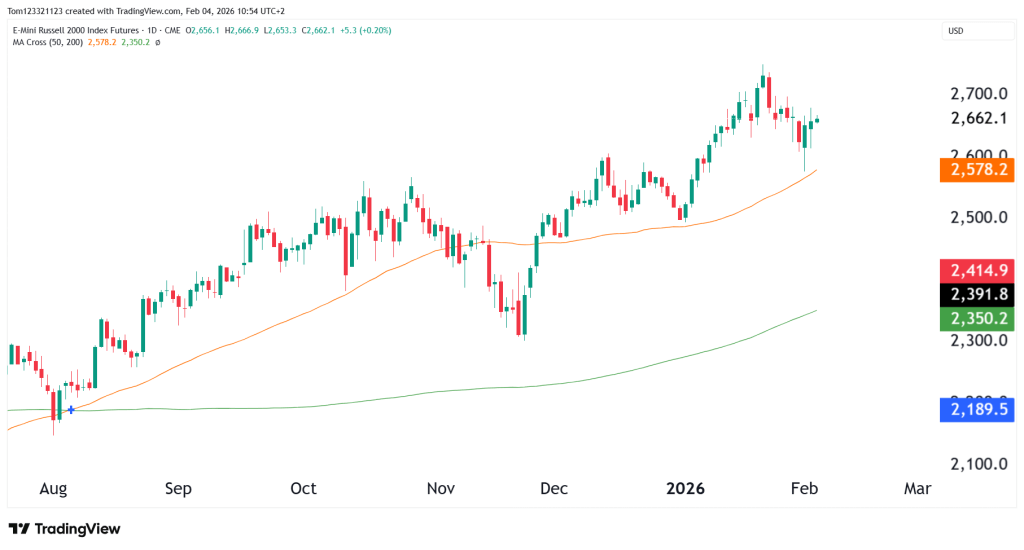
On the daily chart, RTY continues to respect its rising 50-day moving average, which has acted as support since the December low. Pullbacks into this area have been met with buyers, and downside momentum has remained limited.
A few things stand out:
- Higher lows have formed since late November
- Price remains well above the 200-day moving average
- Recent pullbacks have been shallow and corrective, not impulsive
This structure points toward a continuation of the rally as long as the price remains above the 50 moving average.
Key Technical Levels
Line in the Sand
2,500–2,520:
This zone aligns with the rising 50-day moving average and prior breakout structure. Holding above it keeps the current bullish repair intact. A sustained break below would signal that the recent advance is losing traction.
Levels That Shape the Bias
2,650–2,700:
This area represents recent highs and short-term resistance. Acceptance above this zone would strengthen the bullish case and open the door for renewed upside momentum.
Reference and Extension Levels
2,750–2,800:
Potential upside area if RTY transitions from consolidation into a more directional move.
2,400–2,420:
Deeper support if volatility increases and the index revisits prior value.
Looking Forward: Scenarios
Bullish Continuation (40%)
RTY holds above 2,520 and pushes through 2,700, continuing its move higher as the trend becomes more expansive.
Sideways Consolidation (40%)
Price remains range-bound between 2,520 and 2,700, digesting gains while maintaining a constructive structure.
Bearish Breakdown (20%)
A sustained move below the 50-day MA weakens the setup and opens the door to a deeper pullback toward the low-2,400s.
Final Takeaway
The recent price action shows that RTY price action is starting to become more predictable and move in waves. Pullbacks to the 50 day moving average can be good buying opportunities for the bulls moving forward.
This analysis is for educational and informational purposes only and does not constitute trading advice or a recommendation to buy or sell any futures contracts. Futures trading involves significant risk and may not be suitable for all investors. Always conduct your own research and consult with a licensed financial professional before making trading decisions.
