

Introduction
The U.S. stock market has been under heavy selling pressure recently, and small caps are no exception. The Russell 2000 (RTY) Futures have broken down from a long-standing uptrend and the price action has shifted bearish.
With investors growing increasingly risk-averse, recession fears rising, and sticky inflation keeping the Federal Reserve in a hawkish stance, equities are on thin ice. Additionally, concerns over higher bond yields, geopolitical tensions, and weaker corporate earnings have contributed to the bearish sentiment.
With the S&P 500 and Nasdaq also in decline, the Russell 2000—often seen as a barometer for risk appetite—has suffered one of the steepest decline, down 19% since its high in December 2024. Let’s break down the technical picture to assess what’s next for RTY.
Price Action & Key Levels
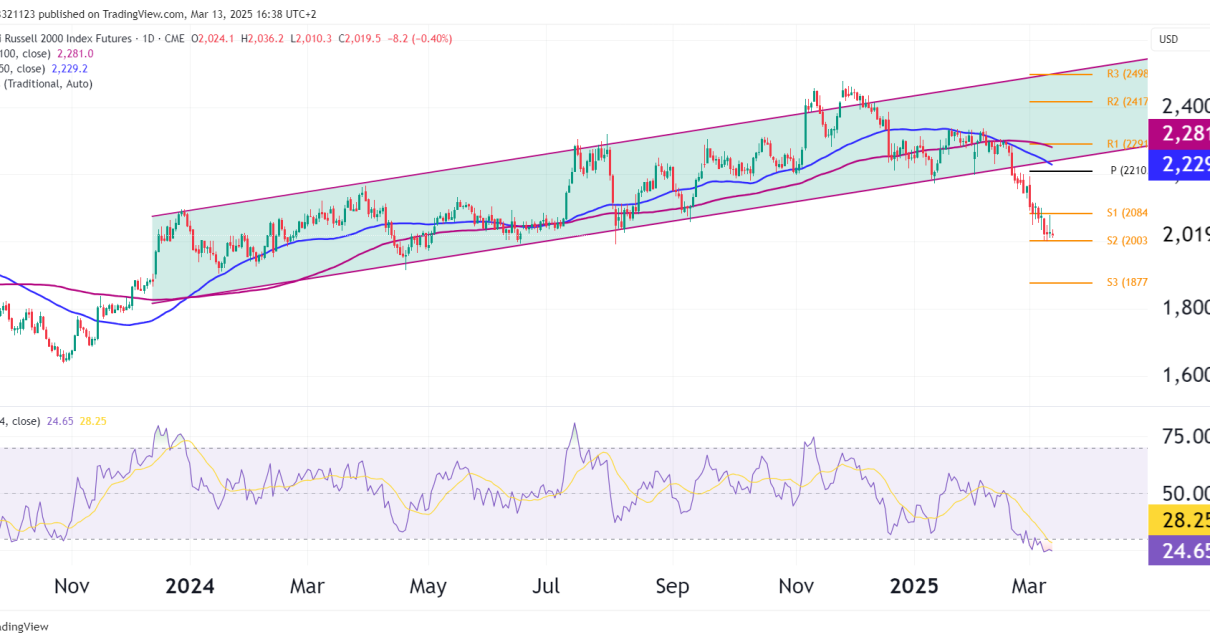
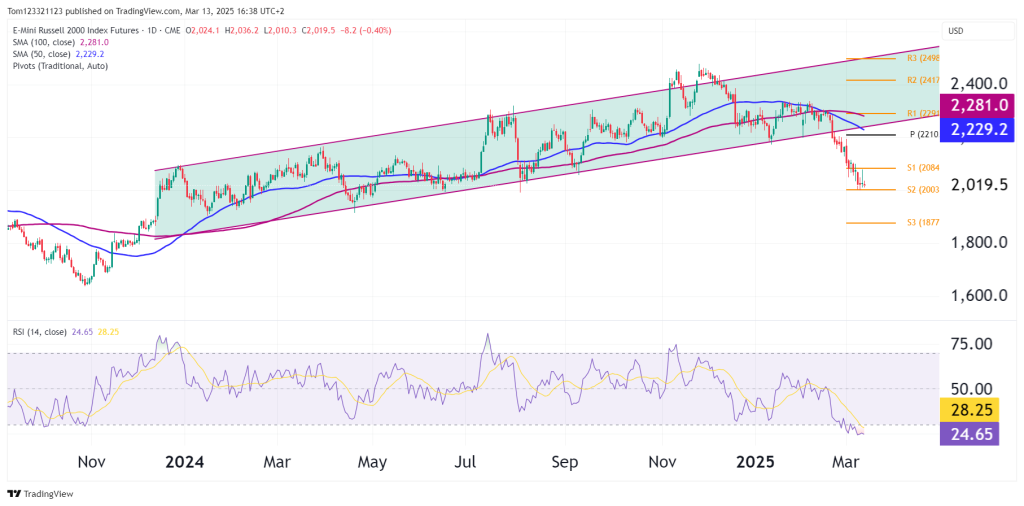
- Support Breakdown: RTY has decisively broken below a multi-month rising channel, which had supported the index since late 2023.
- Current Price: 2,025.7, hovering just above S2 (2,003), with further downside potential.
- Key Resistance Levels:
- The former support at 2,210 (Pivot Level) now acts as a resistance barrier.
- The 50-day SMA (2,229.3) and 100-day SMA (2,281.1) are now well above the price, further confirming a bearish trend.
- Key Support Levels:
- S2 (2,003) – This is the next immediate support level.
- S3 (1,877) – A deeper correction could push the index toward this level.
Technical Indicators
- RSI (14): Currently at 25.16, deep in oversold territory, suggesting that a relief bounce could be imminent. However, the RSI has been trending lower, meaning selling pressure remains dominant.
- Moving Averages:
- Both the 50-day and 100-day SMAs are sloping downward, reinforcing the bearish trend.
- The price is significantly below both moving averages, confirming that the momentum is bearish.
- Volume & Volatility: Selling pressure has intensified, with lower highs and lower lows forming on the chart, signaling a clear downtrend.
Bull & Bear Case Scenarios
Bullish Case:
- Oversold Conditions: The RSI is oversold so a small bounce could be around the corner.
- Short-Covering Rally: If buyers step in at S2 (2,003), a move toward the pivot level at 2,210 could be possible.
- Macro Reversal Catalysts: Any Fed pivot, softer inflation data, or positive economic surprises could ease selling pressure.
Bearish Case:
- Failure to Hold 2,000: A breakdown below 2,003 would open the door to S3 (1,877), a key psychological level.
- Trend Remains Down: The index remains firmly below its major moving averages, with no signs of reversal yet.
- Recession Fears & Rate Uncertainty: If macroeconomic concerns persist, small caps could remain under pressure for the foreseeable future.
Final Thoughts & Trade Outlook
- Short-Term (1-2 Weeks): Bearish to Neutral – Possible relief bounce, but overall trend remains weak.
- Medium-Term (1-2 Months): Bearish – If RTY fails to reclaim 2,210, selling pressure is likely to continue.
- Long-Term (3+ Months): Bearish Unless Reclaimed Above 2,280 – A decisive close above the 100-day SMA (2,281.1) is needed to reverse the bearish trend.
Key Takeaway: RTY has broken down from a long-term uptrend, and the outlook remains bearish unless buyers reclaim key resistance levels. However, with the RSI in deep oversold territory, a short-term bounce is possible. If 2,000 fails to hold, expect further downside toward 1,877.
Possible Trade Setups
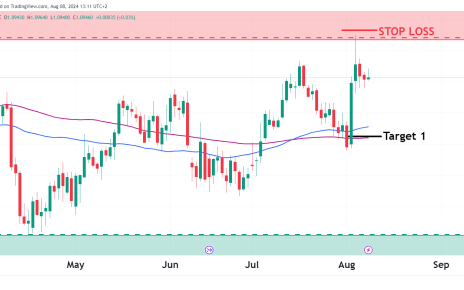
📈 Bullish Setup (Short-Term Reversal Play):
- Buy near 2,003, stop below 1,990, target 2,100-2,210.
📉 Bearish Setup (Trend Continuation):
- Short below 2,000, target 1,880, stop above 2,060.
